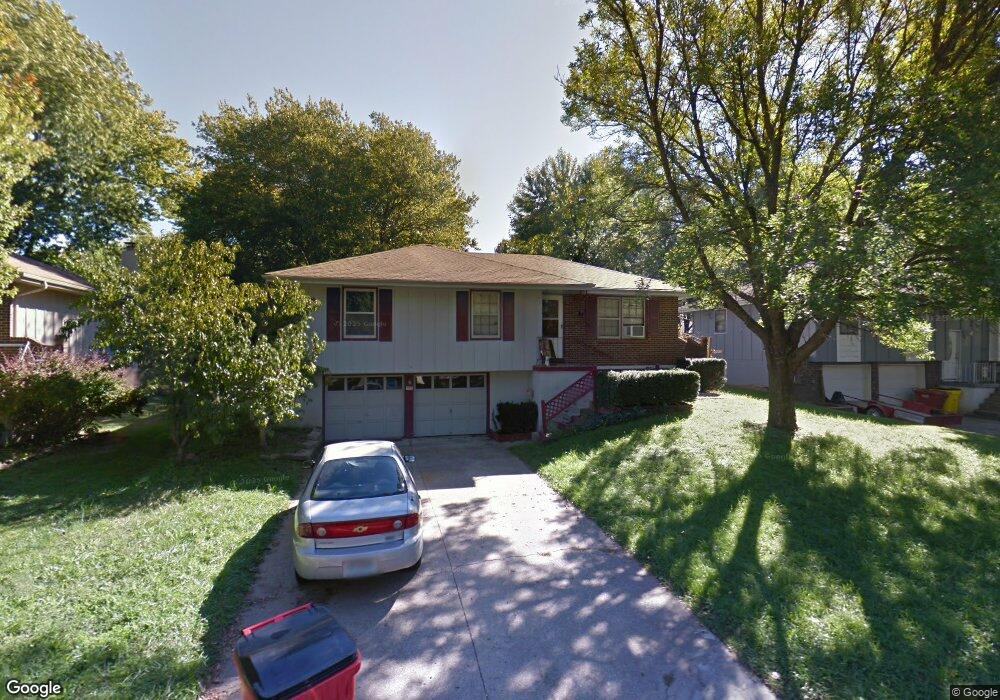
113 Baker St Buckner, MO 64016
Estimated Value: $199,000 - $216,912
3
Beds
2
Baths
1,058
Sq Ft
$200/Sq Ft
Est. Value
About This Home
This home is located at 113 Baker St, Buckner, MO 64016 and is currently estimated at $211,478, approximately $199 per square foot. 113 Baker St is a home located in Jackson County with nearby schools including Fort Osage High School.
Ownership History
Date
Name
Owned For
Owner Type
Purchase Details
Closed on
Oct 26, 1999
Bought by
Arnold Steven G
Current Estimated Value
Home Financials for this Owner
Home Financials are based on the most recent Mortgage that was taken out on this home.
Original Mortgage
$70,961
Outstanding Balance
$21,541
Interest Rate
7.9%
Mortgage Type
FHA
Estimated Equity
$189,937
Purchase Details
Closed on
Apr 5, 1996
Sold by
Friend Andrea S and Neal Andrea S
Bought by
Mccall Russell S and Mccall Wendy
Home Financials for this Owner
Home Financials are based on the most recent Mortgage that was taken out on this home.
Original Mortgage
$61,247
Interest Rate
7.35%
Mortgage Type
FHA
Create a Home Valuation Report for This Property
The Home Valuation Report is an in-depth analysis detailing your home's value as well as a comparison with similar homes in the area
Home Values in the Area
Average Home Value in this Area
Purchase History
| Date | Buyer | Sale Price | Title Company |
|---|---|---|---|
| Arnold Steven G | -- | -- | |
| Mccall Russell S | -- | -- |
Source: Public Records
Mortgage History
| Date | Status | Borrower | Loan Amount |
|---|---|---|---|
| Open | Arnold Steven G | $70,961 | |
| Previous Owner | Mccall Russell S | $61,247 | |
| Closed | Mccall Russell S | $3,145 |
Source: Public Records
Tax History
| Year | Tax Paid | Tax Assessment Tax Assessment Total Assessment is a certain percentage of the fair market value that is determined by local assessors to be the total taxable value of land and additions on the property. | Land | Improvement |
|---|---|---|---|---|
| 2025 | $2,391 | $24,123 | $4,323 | $19,800 |
| 2024 | $2,367 | $25,445 | $3,198 | $22,247 |
| 2023 | $2,367 | $25,445 | $2,915 | $22,530 |
| 2022 | $1,799 | $18,240 | $2,736 | $15,504 |
| 2021 | $1,801 | $18,240 | $2,736 | $15,504 |
| 2020 | $1,667 | $16,589 | $2,736 | $13,853 |
| 2019 | $1,633 | $16,589 | $2,736 | $13,853 |
| 2018 | $1,587 | $15,944 | $2,939 | $13,005 |
| 2017 | $1,587 | $15,944 | $2,939 | $13,005 |
| 2016 | $1,430 | $15,466 | $2,755 | $12,711 |
Source: Public Records
Map
Nearby Homes
- 412 Allen St
- 410 Park Ave
- 315 S Osage St
- 300 Hazel St
- 707 Tall Chief St
- 710 Elliott St
- 814 N Buckner Tarsney Rd
- Intersection of Hunter and Bogart Rd
- 709 Lake City Buckner Rd
- 37603 E Cogswell Rd
- 414 S Borgman Rd
- 1330 N Lake City Valley Rd
- 2614 N Hoover Rd
- 27421 E Blue Mills Rd
- 35407 E Little Rd
- 1125 S Van Dyke Rd
- 1001 S Van Dyke Rd
- 0 N Bogart Rd
- 26612 E Blue Mills Rd
- 1509 S Buckner Tarsney Rd
Your Personal Tour Guide
Ask me questions while you tour the home.