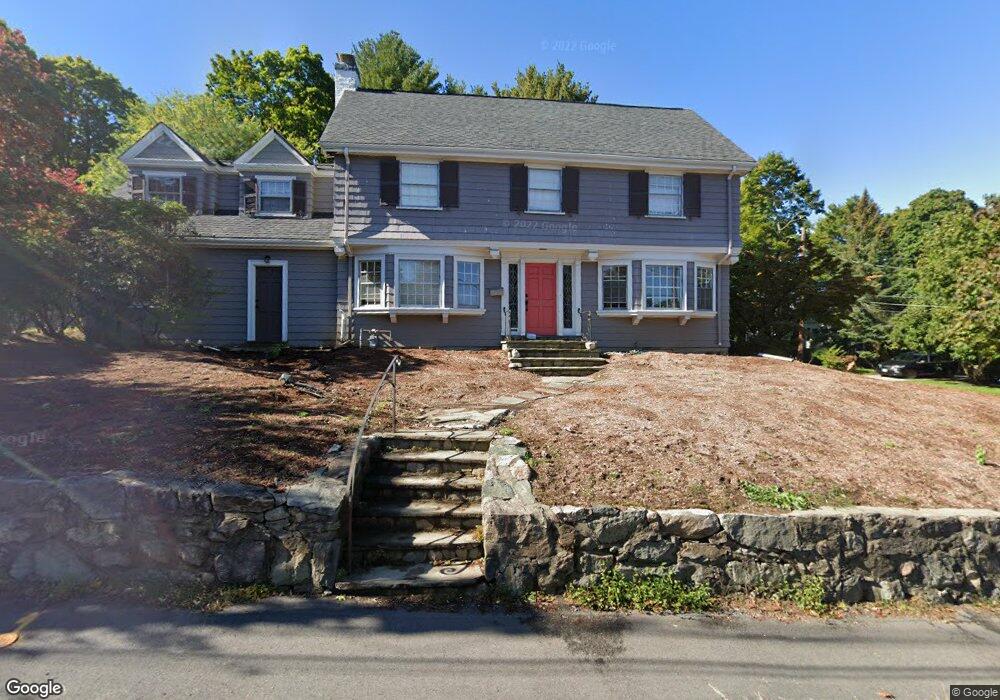
113 Chestnut St West Newton, MA 02465
West Newton NeighborhoodEstimated Value: $2,038,000 - $2,458,000
4
Beds
4
Baths
3,251
Sq Ft
$678/Sq Ft
Est. Value
About This Home
This home is located at 113 Chestnut St, West Newton, MA 02465 and is currently estimated at $2,204,623, approximately $678 per square foot. 113 Chestnut St is a home located in Middlesex County with nearby schools including Peirce Elementary School, F.A. Day Middle School, and Newton North High School.
Ownership History
Date
Name
Owned For
Owner Type
Purchase Details
Closed on
Nov 18, 1997
Sold by
Wecker Rt and Wecker Irving I
Bought by
Abramson Barry M and Abramson Harriet C
Current Estimated Value
Home Financials for this Owner
Home Financials are based on the most recent Mortgage that was taken out on this home.
Original Mortgage
$330,000
Interest Rate
7.23%
Mortgage Type
Purchase Money Mortgage
Create a Home Valuation Report for This Property
The Home Valuation Report is an in-depth analysis detailing your home's value as well as a comparison with similar homes in the area
Home Values in the Area
Average Home Value in this Area
Purchase History
| Date | Buyer | Sale Price | Title Company |
|---|---|---|---|
| Abramson Barry M | $412,500 | -- |
Source: Public Records
Mortgage History
| Date | Status | Borrower | Loan Amount |
|---|---|---|---|
| Open | Abramson Barry M | $424,000 | |
| Closed | Abramson Barry M | $417,000 | |
| Closed | Abramson Barry M | $570,000 | |
| Closed | Abramson Barry M | $330,000 |
Source: Public Records
Tax History Compared to Growth
Tax History
| Year | Tax Paid | Tax Assessment Tax Assessment Total Assessment is a certain percentage of the fair market value that is determined by local assessors to be the total taxable value of land and additions on the property. | Land | Improvement |
|---|---|---|---|---|
| 2025 | $17,054 | $1,740,200 | $1,172,700 | $567,500 |
| 2024 | $16,490 | $1,689,500 | $1,138,500 | $551,000 |
| 2023 | $15,802 | $1,552,300 | $884,800 | $667,500 |
| 2022 | $15,120 | $1,437,300 | $819,300 | $618,000 |
| 2021 | $14,589 | $1,355,900 | $772,900 | $583,000 |
| 2020 | $6,202 | $1,355,900 | $772,900 | $583,000 |
| 2019 | $6,007 | $1,316,400 | $750,400 | $566,000 |
| 2018 | $13,434 | $1,241,600 | $678,600 | $563,000 |
| 2017 | $13,025 | $1,171,300 | $640,200 | $531,100 |
| 2016 | $12,458 | $1,094,700 | $598,300 | $496,400 |
| 2015 | $11,878 | $1,023,100 | $559,200 | $463,900 |
Source: Public Records
Map
Nearby Homes
- 318 Austin St Unit A
- 18 Sewall St
- 40 Sewall St
- 39 Valentine Park
- 27 Cross St Unit 27
- 12 Wiswall St
- 1488 Washington St Unit 1488
- 222 Prince St
- 4 Wiswall St
- 123 Mount Vernon St Unit 2
- 371 Cherry St
- 10 Ruane Rd
- 308 Prince St
- 2 Elm St Unit 6
- 2 Elm St Unit 8
- 106 River St Unit 18
- 106 River St Unit 2
- 106 River St Unit 14
- 0 Duncan Rd Unit 72925240
- 41 Kilburn Rd
- 117 Chestnut St
- 20 Richfield Rd
- 5 Richfield Rd
- 11 Richfield Rd
- 112 Chestnut St
- 120 Chestnut St
- 17 Richfield Rd
- 100 Chestnut St
- 129 Chestnut St
- 3 Fairview Terrace
- 11 Fairview Terrace
- 25 Westfield Rd
- 25 Westfield Rd Unit STU W. Newton
- 25 Westfield Rd
- 25 Westfield Rd Unit 1
- 29 Westfield Rd
- 124 Highland St
- 110 Highland St
- 35 Westfield Rd
- 17 Fairview Terrace