Estimated Value: $510,124 - $550,000
4
Beds
2
Baths
1,666
Sq Ft
$316/Sq Ft
Est. Value
About This Home
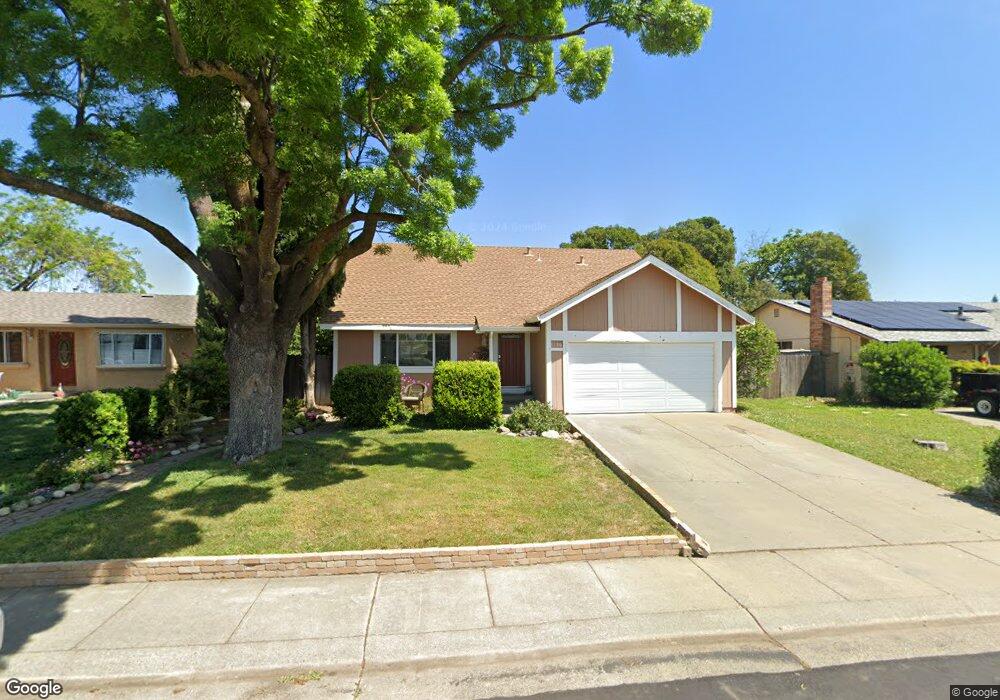
This home is located at 1130 W F St Unit 3, Dixon, CA 95620 and is currently estimated at $526,531, approximately $316 per square foot. 1130 W F St Unit 3 is a home located in Solano County with nearby schools including Anderson (Linford L.) Elementary School, Dixon High School, and Dixon Montessori Charter.
Ownership History
Date
Name
Owned For
Owner Type
Purchase Details
Closed on
May 5, 1999
Sold by
Callahan Patricia L
Bought by
Callahan Scott D and Callahan Patricia L
Current Estimated Value
Home Financials for this Owner
Home Financials are based on the most recent Mortgage that was taken out on this home.
Original Mortgage
$140,338
Outstanding Balance
$35,961
Interest Rate
6.94%
Mortgage Type
FHA
Estimated Equity
$490,570
Purchase Details
Closed on
Aug 24, 1995
Sold by
Harris Lincoln and Harris Grace K
Bought by
Callahan Patricia L and Callahan Scott
Purchase Details
Closed on
Jul 13, 1993
Sold by
Tallent Donald Muriel and Tallent Renate
Bought by
Harris Lincoln and Harris Grace K
Home Financials for this Owner
Home Financials are based on the most recent Mortgage that was taken out on this home.
Original Mortgage
$134,930
Interest Rate
5.5%
Mortgage Type
FHA
Create a Home Valuation Report for This Property
The Home Valuation Report is an in-depth analysis detailing your home's value as well as a comparison with similar homes in the area
Home Values in the Area
Average Home Value in this Area
Purchase History
| Date | Buyer | Sale Price | Title Company |
|---|---|---|---|
| Callahan Scott D | -- | Fidelity National Title Co | |
| Callahan Patricia L | $1,000 | North American Title Co | |
| Harris Lincoln | $135,000 | First American Title Guarant |
Source: Public Records
Mortgage History
| Date | Status | Borrower | Loan Amount |
|---|---|---|---|
| Open | Callahan Scott D | $140,338 | |
| Previous Owner | Harris Lincoln | $134,930 |
Source: Public Records
Tax History
| Year | Tax Paid | Tax Assessment Tax Assessment Total Assessment is a certain percentage of the fair market value that is determined by local assessors to be the total taxable value of land and additions on the property. | Land | Improvement |
|---|---|---|---|---|
| 2025 | $2,358 | $219,281 | $74,754 | $144,527 |
| 2024 | $2,358 | $214,983 | $73,289 | $141,694 |
| 2023 | $2,287 | $210,768 | $71,852 | $138,916 |
| 2022 | $2,252 | $206,637 | $70,445 | $136,192 |
| 2021 | $2,223 | $202,586 | $69,064 | $133,522 |
| 2020 | $2,186 | $200,509 | $68,356 | $132,153 |
| 2019 | $2,144 | $196,578 | $67,016 | $129,562 |
| 2018 | $2,135 | $192,724 | $65,702 | $127,022 |
| 2017 | $2,080 | $188,946 | $64,414 | $124,532 |
| 2016 | $1,982 | $185,242 | $63,151 | $122,091 |
| 2015 | $1,936 | $182,461 | $62,203 | $120,258 |
| 2014 | $1,914 | $178,888 | $60,985 | $117,903 |
Source: Public Records
Map
Nearby Homes
Your Personal Tour Guide
Ask me questions while you tour the home.