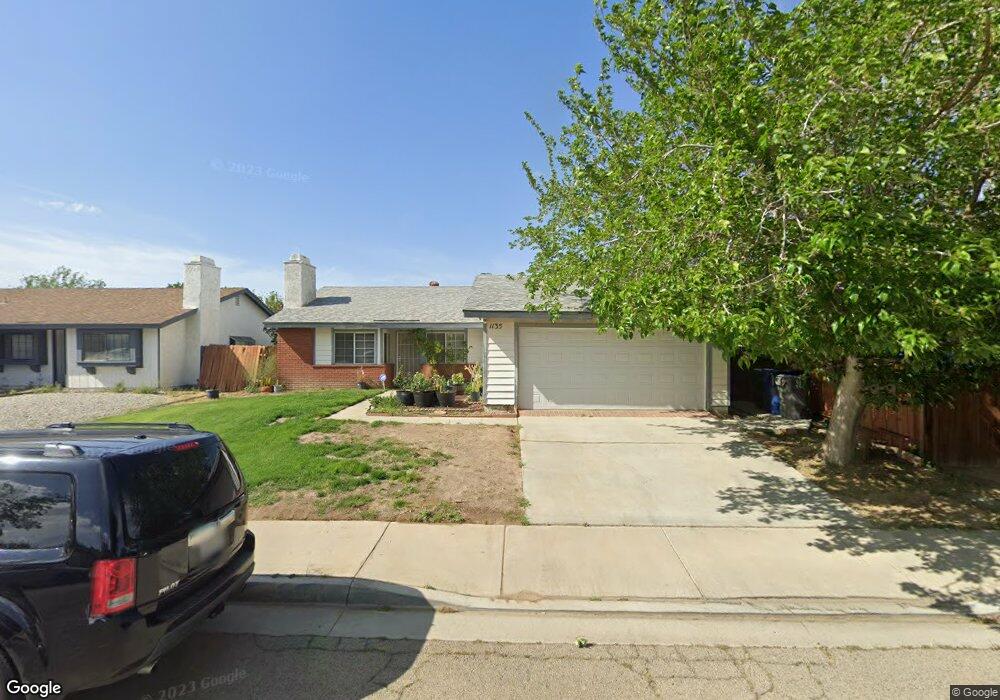
1135 Lightcap St Lancaster, CA 93535
East Lancaster NeighborhoodEstimated Value: $383,000 - $411,000
3
Beds
2
Baths
1,449
Sq Ft
$278/Sq Ft
Est. Value
About This Home
This home is located at 1135 Lightcap St, Lancaster, CA 93535 and is currently estimated at $402,925, approximately $278 per square foot. 1135 Lightcap St is a home located in Los Angeles County with nearby schools including Discovery Elementary School, Piute Middle School, and Eastside High School.
Ownership History
Date
Name
Owned For
Owner Type
Purchase Details
Closed on
Sep 9, 2009
Sold by
Hernandez Enrique
Bought by
Hernandez Enrique
Current Estimated Value
Purchase Details
Closed on
Aug 26, 2003
Sold by
Hernandez Ann R
Bought by
Hernandez Enrique C
Home Financials for this Owner
Home Financials are based on the most recent Mortgage that was taken out on this home.
Original Mortgage
$129,600
Outstanding Balance
$58,587
Interest Rate
5.87%
Mortgage Type
Purchase Money Mortgage
Estimated Equity
$344,338
Create a Home Valuation Report for This Property
The Home Valuation Report is an in-depth analysis detailing your home's value as well as a comparison with similar homes in the area
Home Values in the Area
Average Home Value in this Area
Purchase History
| Date | Buyer | Sale Price | Title Company |
|---|---|---|---|
| Hernandez Enrique | -- | None Available | |
| Hernandez Enrique C | -- | Fidelity National Title |
Source: Public Records
Mortgage History
| Date | Status | Borrower | Loan Amount |
|---|---|---|---|
| Open | Hernandez Enrique C | $129,600 |
Source: Public Records
Tax History
| Year | Tax Paid | Tax Assessment Tax Assessment Total Assessment is a certain percentage of the fair market value that is determined by local assessors to be the total taxable value of land and additions on the property. | Land | Improvement |
|---|---|---|---|---|
| 2025 | $3,585 | $187,148 | $39,808 | $147,340 |
| 2024 | $3,585 | $183,479 | $39,028 | $144,451 |
| 2023 | $3,512 | $179,882 | $38,263 | $141,619 |
| 2022 | $3,318 | $176,356 | $37,513 | $138,843 |
| 2021 | $2,930 | $172,899 | $36,778 | $136,121 |
| 2019 | $2,850 | $167,773 | $35,688 | $132,085 |
| 2018 | $2,800 | $164,485 | $34,989 | $129,496 |
| 2016 | $2,658 | $158,099 | $33,631 | $124,468 |
| 2015 | $2,626 | $155,725 | $33,126 | $122,599 |
| 2014 | $2,616 | $152,676 | $32,478 | $120,198 |
Source: Public Records
Map
Nearby Homes
- 1129 Lightcap St
- 1027 Landsford St
- 1109 E Kildare St
- 44727 Benald St
- 44800 Denmore Ave
- 44919 Fenhold St
- 44633 Calston Ave
- 44840 Fenhold St
- 1304 E Avenue I Unit 8
- 1304 E Avenue I Unit 9
- 1304 E Avenue I Unit Spc 35
- 44827 Rock Island Dr
- 45015 Denmore Ave
- 1213 Morven St
- 1132 Morven St
- 1111 Caperton St
- 830 Sunrise Ct
- 44508 15th St E Unit 12
- 45050 Bevington Ave
- 44727 Andale Ave
- 44803 12th St E
- 44811 12th St E
- 1121 Lightcap St
- 44819 12th St E
- 1146 Landsford St
- 1140 Landsford St
- 1134 Landsford St
- 1111 Lightcap St
- 1132 Lightcap St
- 1126 Lightcap St
- 44825 12th St E
- 1140 Lightcap St
- 1128 Landsford St
- 1120 Lightcap St
- 1146 Lightcap St Unit 1
- 1146 Lightcap St
- 1114 Lightcap St
- 44806 12th St E
- 44820 11th St E
- 44828 11th St E
Your Personal Tour Guide
Ask me questions while you tour the home.