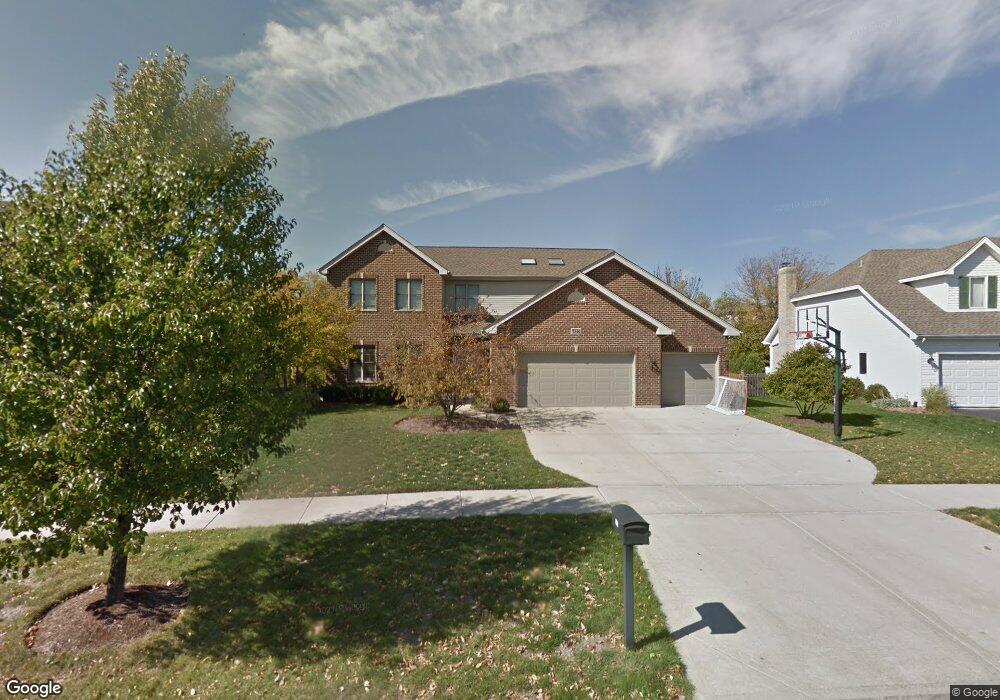
1135 Tuscany Ln Unit 3 Naperville, IL 60564
Rose Hill Farm NeighborhoodEstimated Value: $639,000 - $800,000
4
Beds
3
Baths
2,862
Sq Ft
$241/Sq Ft
Est. Value
About This Home
This home is located at 1135 Tuscany Ln Unit 3, Naperville, IL 60564 and is currently estimated at $688,755, approximately $240 per square foot. 1135 Tuscany Ln Unit 3 is a home located in Will County with nearby schools including Ellsworth Elementary School, Gordon Gregory Middle School, and Neuqua Valley High School.
Ownership History
Date
Name
Owned For
Owner Type
Purchase Details
Closed on
Jun 30, 2003
Sold by
Konieczny Mark A and Konieczny Julianna
Bought by
Kulak Phillip G and Kulak Susan L
Current Estimated Value
Home Financials for this Owner
Home Financials are based on the most recent Mortgage that was taken out on this home.
Original Mortgage
$180,000
Outstanding Balance
$77,103
Interest Rate
5.36%
Mortgage Type
Purchase Money Mortgage
Estimated Equity
$611,652
Purchase Details
Closed on
May 16, 1994
Sold by
Gilmore John G
Bought by
Konieczny Mark A and Konieczny Julianna
Home Financials for this Owner
Home Financials are based on the most recent Mortgage that was taken out on this home.
Original Mortgage
$196,000
Interest Rate
8.34%
Purchase Details
Closed on
Jan 29, 1994
Sold by
Chicago Title & Trust Company
Bought by
Mcdonnell Builders Inc
Create a Home Valuation Report for This Property
The Home Valuation Report is an in-depth analysis detailing your home's value as well as a comparison with similar homes in the area
Home Values in the Area
Average Home Value in this Area
Purchase History
| Date | Buyer | Sale Price | Title Company |
|---|---|---|---|
| Kulak Phillip G | $382,500 | -- | |
| Konieczny Mark A | $245,000 | Chicago Title Insurance Co | |
| Konieczny Mark A | -- | Chicago Title Insurance Co | |
| Mcdonnell Builders Inc | $60,000 | Chicago Title Insurance Co |
Source: Public Records
Mortgage History
| Date | Status | Borrower | Loan Amount |
|---|---|---|---|
| Open | Kulak Phillip G | $180,000 | |
| Previous Owner | Konieczny Mark A | $196,000 |
Source: Public Records
Tax History Compared to Growth
Tax History
| Year | Tax Paid | Tax Assessment Tax Assessment Total Assessment is a certain percentage of the fair market value that is determined by local assessors to be the total taxable value of land and additions on the property. | Land | Improvement |
|---|---|---|---|---|
| 2024 | $12,183 | $193,999 | $42,795 | $151,204 |
| 2023 | $12,183 | $171,377 | $37,805 | $133,572 |
| 2022 | $11,268 | $161,530 | $35,764 | $125,766 |
| 2021 | $10,769 | $153,838 | $34,061 | $119,777 |
| 2020 | $10,563 | $151,400 | $33,521 | $117,879 |
| 2019 | $10,381 | $147,133 | $32,576 | $114,557 |
| 2018 | $10,649 | $148,157 | $31,858 | $116,299 |
| 2017 | $10,486 | $144,333 | $31,036 | $113,297 |
| 2016 | $10,466 | $141,226 | $30,368 | $110,858 |
| 2015 | $9,880 | $135,794 | $29,200 | $106,594 |
| 2014 | $9,880 | $126,104 | $29,200 | $96,904 |
| 2013 | $9,880 | $126,104 | $29,200 | $96,904 |
Source: Public Records
Map
Nearby Homes
- 1112 Saratoga Ct
- 3816 Rosada Dr
- 3432 Caine Dr
- 3616 Eliot Ln
- 3508 Tussell St
- 1116 Hollingswood Ave
- 945 Winners Cup Ct Unit 945
- 1804 Princess Cir
- 1736 Robert Ln
- 3004 Bennett Dr
- 1123 Thackery Ln
- 1987 Baldwin Way
- 164 Willow Bend
- 2741 Gateshead Dr
- 2949 Brossman St
- 1834 Marne Rd
- 2255 Wendt Cir
- 29W316 Andermann Dr
- 2636 Salix Cir
- 1305 Morningstar Ct Unit 1A
- 1131 Tuscany Ln
- 1139 Tuscany Ln
- 3716 Parador Dr
- 3720 Parador Dr Unit 2
- 3732 Parador Dr
- 1127 Tuscany Ln
- 3712 Parador Dr
- 1143 Tuscany Ln
- 1136 Tuscany Ln
- 3736 Parador Dr
- 1128 Tuscany Ln
- 3708 Parador Dr
- 1148 Tuscany Ln
- 3740 Parador Dr
- 1147 Tuscany Ln
- 1123 Tuscany Ln
- 1120 Tuscany Ln
- 3744 Parador Dr
- 1123 Magenta Ct
- 3715 Parador Dr