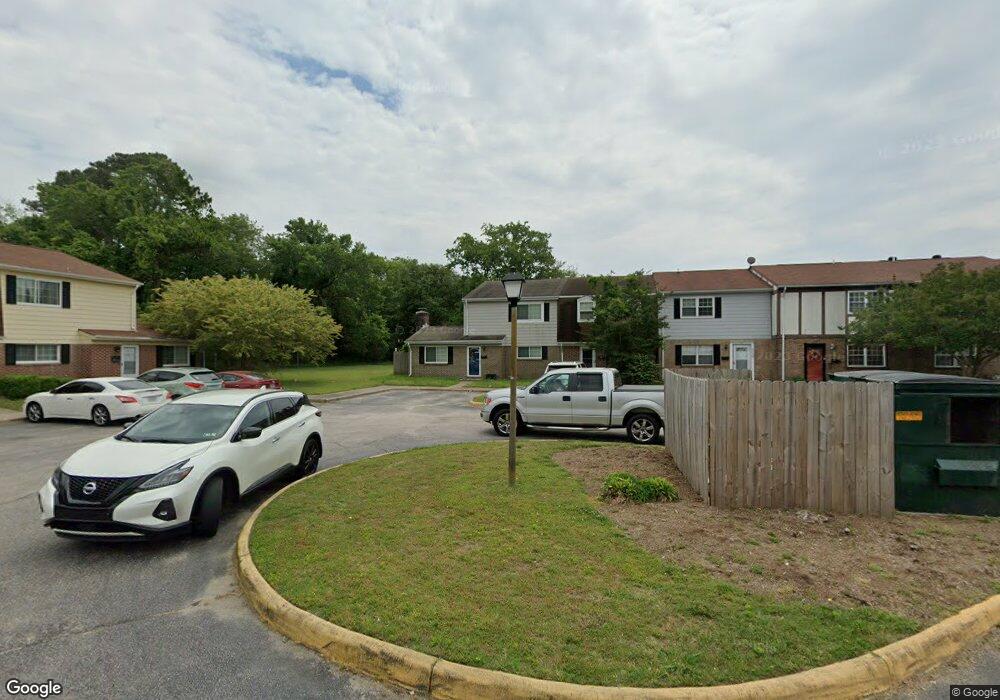
114 Tyburn Ct Hampton, VA 23669
Willow Oaks NeighborhoodEstimated Value: $243,000 - $288,000
3
Beds
3
Baths
1,881
Sq Ft
$143/Sq Ft
Est. Value
About This Home
This home is located at 114 Tyburn Ct, Hampton, VA 23669 and is currently estimated at $269,087, approximately $143 per square foot. 114 Tyburn Ct is a home located in Hampton City with nearby schools including Mary S. Peake Elementary School, Benjamin Syms Middle School, and Kecoughtan High School.
Ownership History
Date
Name
Owned For
Owner Type
Purchase Details
Closed on
Sep 25, 2015
Sold by
Langer Victoria L
Bought by
Javel Fritz J
Current Estimated Value
Home Financials for this Owner
Home Financials are based on the most recent Mortgage that was taken out on this home.
Original Mortgage
$158,332
Outstanding Balance
$123,199
Interest Rate
3.88%
Mortgage Type
VA
Estimated Equity
$145,888
Purchase Details
Closed on
Feb 24, 2014
Sold by
Bates Archie P
Bought by
Langer Victoria L
Home Financials for this Owner
Home Financials are based on the most recent Mortgage that was taken out on this home.
Original Mortgage
$122,580
Interest Rate
4.32%
Mortgage Type
VA
Purchase Details
Closed on
Jun 26, 2001
Sold by
Sec Veterans Affairs
Bought by
Bates Archie P
Home Financials for this Owner
Home Financials are based on the most recent Mortgage that was taken out on this home.
Original Mortgage
$72,100
Interest Rate
7.14%
Create a Home Valuation Report for This Property
The Home Valuation Report is an in-depth analysis detailing your home's value as well as a comparison with similar homes in the area
Home Values in the Area
Average Home Value in this Area
Purchase History
| Date | Buyer | Sale Price | Title Company |
|---|---|---|---|
| Javel Fritz J | $155,000 | None Available | |
| Langer Victoria L | $120,000 | -- | |
| Bates Archie P | $72,101 | -- |
Source: Public Records
Mortgage History
| Date | Status | Borrower | Loan Amount |
|---|---|---|---|
| Open | Javel Fritz J | $158,332 | |
| Previous Owner | Langer Victoria L | $122,580 | |
| Previous Owner | Bates Archie P | $72,100 |
Source: Public Records
Tax History
| Year | Tax Paid | Tax Assessment Tax Assessment Total Assessment is a certain percentage of the fair market value that is determined by local assessors to be the total taxable value of land and additions on the property. | Land | Improvement |
|---|---|---|---|---|
| 2025 | $3,089 | $275,300 | $48,000 | $227,300 |
| 2024 | $2,744 | $238,600 | $46,000 | $192,600 |
| 2023 | $2,470 | $212,900 | $46,000 | $166,900 |
| 2022 | $2,300 | $194,900 | $34,500 | $160,400 |
| 2021 | $2,159 | $163,600 | $28,800 | $134,800 |
| 2020 | $1,923 | $155,100 | $28,800 | $126,300 |
| 2019 | $1,964 | $158,400 | $28,800 | $129,600 |
| 2018 | $1,797 | $154,500 | $28,800 | $125,700 |
| 2017 | $2,010 | $0 | $0 | $0 |
| 2016 | $2,010 | $154,500 | $0 | $0 |
| 2015 | $792 | $0 | $0 | $0 |
| 2014 | $1,917 | $148,200 | $34,500 | $113,700 |
Source: Public Records
Map
Nearby Homes
- 108 Tyburn Ct
- 312 Nelson Pkwy
- 1563 N King St Unit 114
- 43 Hampshire Dr
- 19 Michele Dr
- 111 Boeing Ave
- 10 Sperry Ct
- 2 Boeing Ave
- 18 Beverly St
- 12 Kingslee Ln
- 2 Coffman Cir
- 330 Wilderness Rd
- 118 Margaret Dr
- 49 Madrid Dr
- 161 Chickamauga Pike
- 35 Westover St
- 69 W Little Back River Rd
- 67 W Little Back River Rd
- 222 Clemwood Pkwy
- 312 Shawen Dr
- 112 Tyburn Ct
- 110 Tyburn Ct
- 115 Hampstead Ct
- 118 Tyburn Ct
- 106 Tyburn Ct
- 113 Hampstead Ct
- 111 Hampstead Ct
- 104 Tyburn Ct
- 120 Tyburn Ct
- 109 Hampstead Ct
- 102 Tyburn Ct
- 121 Tyburn Ct
- 107 Hampstead Ct
- 105 Hampstead Ct
- 100 Tyburn Ct
- 119 Tyburn Ct
- 103 Hampstead Ct
- 119 Hampstead Ct
- 101 Hampstead Ct
- 302 Tysinger Dr
Your Personal Tour Guide
Ask me questions while you tour the home.