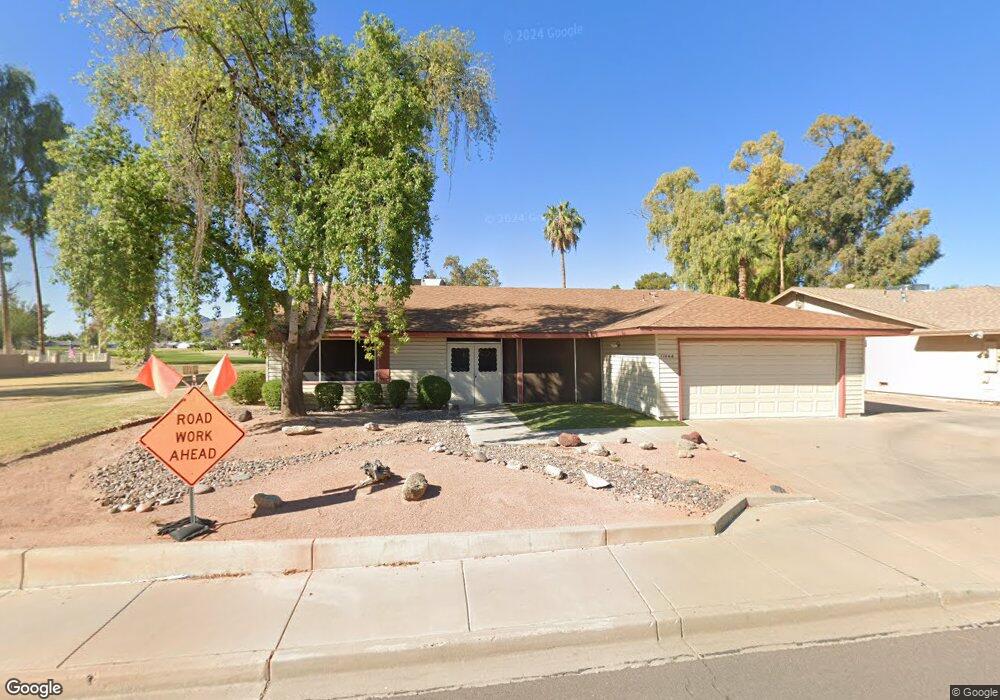
11444 S 51st St Phoenix, AZ 85044
Ahwatukee NeighborhoodEstimated Value: $410,000 - $446,000
2
Beds
2
Baths
1,785
Sq Ft
$236/Sq Ft
Est. Value
About This Home
This home is located at 11444 S 51st St, Phoenix, AZ 85044 and is currently estimated at $421,978, approximately $236 per square foot. 11444 S 51st St is a home located in Maricopa County with nearby schools including Kyrene de las Lomas School, Kyrene Centennial Middle School, and Mountain Pointe High School.
Ownership History
Date
Name
Owned For
Owner Type
Purchase Details
Closed on
Jan 16, 2004
Sold by
Johnson Edward E and Johnson Joan M
Bought by
Dierenfield Ronald and Dierenfield Ellen
Current Estimated Value
Purchase Details
Closed on
Apr 19, 2002
Sold by
Hammarstrom Thomas J
Bought by
Johnson Edward E and Johnson Joan M
Home Financials for this Owner
Home Financials are based on the most recent Mortgage that was taken out on this home.
Original Mortgage
$92,000
Interest Rate
6.87%
Mortgage Type
New Conventional
Purchase Details
Closed on
Jun 19, 1998
Sold by
M & B Capital Group Llc
Bought by
Vestar Arizona Xvi Llc
Purchase Details
Closed on
Jun 18, 1998
Sold by
I-10-97 Llc
Bought by
M & B Capital Group Llc
Purchase Details
Closed on
Jan 10, 1997
Sold by
Waddell Seid
Bought by
Waddell Seid and The Seid Waddell Living Trust
Create a Home Valuation Report for This Property
The Home Valuation Report is an in-depth analysis detailing your home's value as well as a comparison with similar homes in the area
Home Values in the Area
Average Home Value in this Area
Purchase History
| Date | Buyer | Sale Price | Title Company |
|---|---|---|---|
| Dierenfield Ronald | $150,000 | North American Title Co | |
| Johnson Edward E | $127,000 | Title Guaranty Agency | |
| Vestar Arizona Xvi Llc | $992,346 | Lawyers Title Of Arizona Inc | |
| M & B Capital Group Llc | -- | Lawyers Title Of Arizona Inc | |
| Waddell Seid | -- | -- |
Source: Public Records
Mortgage History
| Date | Status | Borrower | Loan Amount |
|---|---|---|---|
| Previous Owner | Johnson Edward E | $92,000 |
Source: Public Records
Tax History Compared to Growth
Tax History
| Year | Tax Paid | Tax Assessment Tax Assessment Total Assessment is a certain percentage of the fair market value that is determined by local assessors to be the total taxable value of land and additions on the property. | Land | Improvement |
|---|---|---|---|---|
| 2025 | $2,201 | $21,504 | -- | -- |
| 2024 | $2,158 | $18,691 | -- | -- |
| 2023 | $2,158 | $31,230 | $6,240 | $24,990 |
| 2022 | $1,747 | $24,730 | $4,940 | $19,790 |
| 2021 | $1,823 | $22,630 | $4,520 | $18,110 |
| 2020 | $1,777 | $21,900 | $4,380 | $17,520 |
| 2019 | $1,721 | $19,710 | $3,940 | $15,770 |
| 2018 | $1,662 | $18,550 | $3,710 | $14,840 |
| 2017 | $1,586 | $17,010 | $3,400 | $13,610 |
| 2016 | $1,607 | $16,200 | $3,240 | $12,960 |
| 2015 | $1,439 | $15,150 | $3,030 | $12,120 |
Source: Public Records
Map
Nearby Homes
- 5047 E Mesquite Wood Ct
- 11604 S Ki Rd
- 5015 E Cheyenne Dr Unit 14
- 11605 S Jokake St
- 4946 E Lake Point Cir
- 5202 E Tamblo Dr
- 4916 E Hopi St
- 4901 E Magic Stone Dr
- 5204 E Saguaro Cir
- 11837 S Tonopah Dr
- 11839 S Tonopah Dr
- 4846 E Paiute St
- 11233 S Iroquois Dr
- 11831 S Paiute St
- 11449 S Iroquois Dr
- 12154 S Ki Rd
- 12049 S Potomac St
- 11401 S Shoshoni Dr
- 12059 S Paiute St
- 12243 S Chippewa Dr
- 11436 S 51st St
- 11430 S 51st St
- 11602 S 51st St
- 11608 S 51st St
- 5041 E Mesquite Wood Ct
- 11440 S Maze Ct
- 11438 S Maze Ct
- 11436 S Maze Ct
- 5029 E Mesquite Wood Ct
- 11444 S Maze Ct
- 11434 S Maze Ct
- 11428 S Ki Rd
- 11420 S Ki Rd
- 11446 S Maze Ct
- 5023 E Mesquite Wood Ct
- 11416 S Ki Rd
- 11620 S 51st St
- 11616 S 51st St
- 11412 S Ki Rd