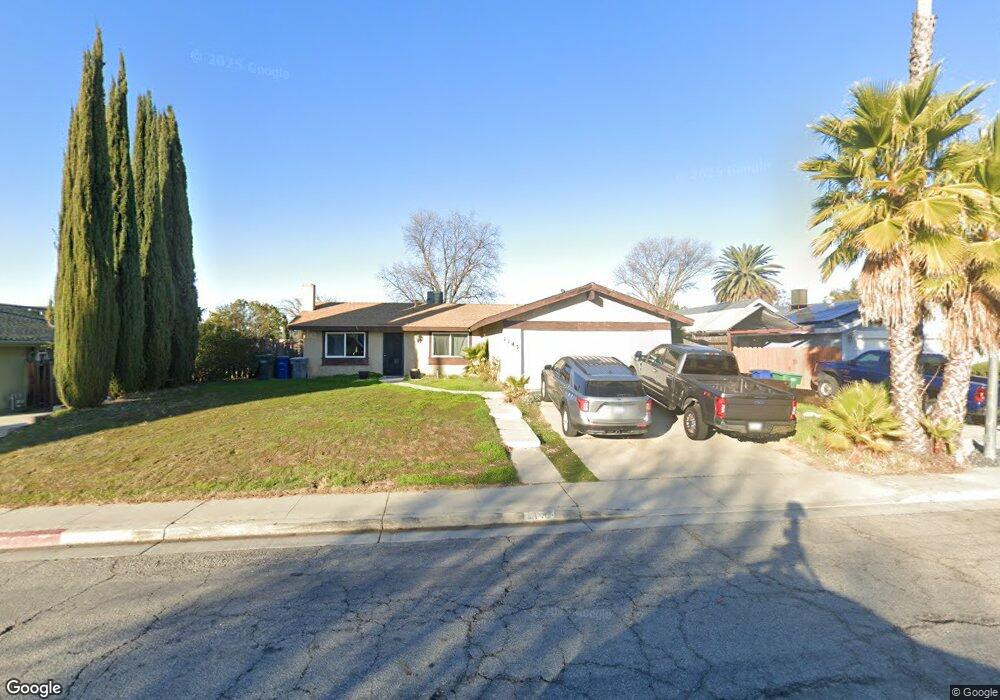
1145 Nanette Ln Paso Robles, CA 93446
Estimated Value: $483,960 - $582,000
3
Beds
2
Baths
1,044
Sq Ft
$529/Sq Ft
Est. Value
About This Home
This home is located at 1145 Nanette Ln, Paso Robles, CA 93446 and is currently estimated at $552,740, approximately $529 per square foot. 1145 Nanette Ln is a home located in San Luis Obispo County with nearby schools including Winifred Pifer Elementary School, Daniel Lewis Middle School, and Paso Robles High School.
Ownership History
Date
Name
Owned For
Owner Type
Purchase Details
Closed on
Mar 20, 2014
Sold by
Sorensen Neil C and Sorensen Karen L
Bought by
Sorensen Revoc Neil C and Sorensen Revoc Karen L
Current Estimated Value
Purchase Details
Closed on
Mar 23, 1994
Sold by
Henry Henry G G and Henry Connie L
Bought by
Sorensen Neil C and Sorensen Karen L
Home Financials for this Owner
Home Financials are based on the most recent Mortgage that was taken out on this home.
Original Mortgage
$11,000
Interest Rate
7.79%
Create a Home Valuation Report for This Property
The Home Valuation Report is an in-depth analysis detailing your home's value as well as a comparison with similar homes in the area
Home Values in the Area
Average Home Value in this Area
Purchase History
| Date | Buyer | Sale Price | Title Company |
|---|---|---|---|
| Sorensen Revoc Neil C | -- | None Available | |
| Sorensen Neil C | $100,000 | Ticor Title Insurance Compan |
Source: Public Records
Mortgage History
| Date | Status | Borrower | Loan Amount |
|---|---|---|---|
| Closed | Sorensen Neil C | $11,000 |
Source: Public Records
Tax History Compared to Growth
Tax History
| Year | Tax Paid | Tax Assessment Tax Assessment Total Assessment is a certain percentage of the fair market value that is determined by local assessors to be the total taxable value of land and additions on the property. | Land | Improvement |
|---|---|---|---|---|
| 2025 | $1,982 | $181,826 | $76,466 | $105,360 |
| 2024 | $1,950 | $178,262 | $74,967 | $103,295 |
| 2023 | $1,950 | $174,768 | $73,498 | $101,270 |
| 2022 | $1,921 | $171,342 | $72,057 | $99,285 |
| 2021 | $1,888 | $167,984 | $70,645 | $97,339 |
| 2020 | $1,862 | $166,262 | $69,921 | $96,341 |
| 2019 | $1,836 | $163,002 | $68,550 | $94,452 |
| 2018 | $1,811 | $159,806 | $67,206 | $92,600 |
| 2017 | $1,703 | $156,674 | $65,889 | $90,785 |
| 2016 | $1,669 | $153,603 | $64,598 | $89,005 |
| 2015 | $1,663 | $151,297 | $63,628 | $87,669 |
| 2014 | $1,605 | $148,334 | $62,382 | $85,952 |
Source: Public Records
Map
Nearby Homes
- 1024 Rachel Ln
- 1128 Golf Place
- 225 Lark Dr
- 230 Partridge Ave
- 715 Orchard Dr
- 4 Dove Ct
- 470 Nickerson Dr
- 326 Partridge Ave
- 1320 Teal Ave
- 315 Oak Meadow Ln
- 845 Creston Rd
- 338 Partridge Ave
- 912 Wade Dr
- 915 Moran Ct
- 0 Orchard Dr
- 331 Wild Mustard Ln
- 821 Marlbank Place
- 726 N Trigo Ln
- 912 Salida Del Sol Dr
- 833 Rolling Hills Rd Unit 16