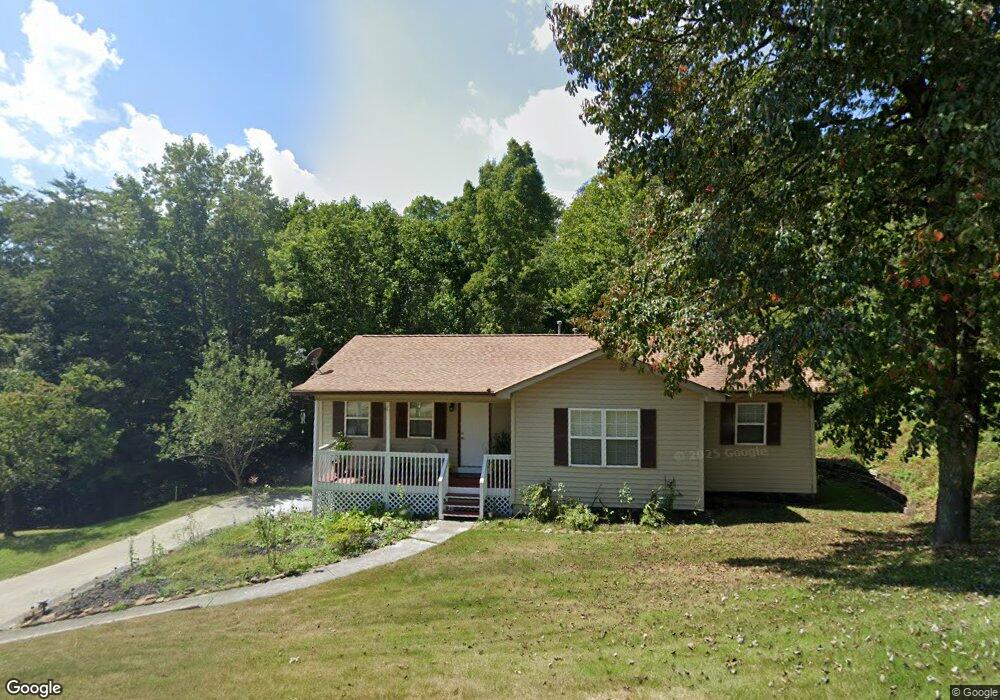
115 Pine Hill Ln Heiskell, TN 37754
East Clinton NeighborhoodEstimated Value: $313,163 - $402,000
Studio
2
Baths
1,248
Sq Ft
$283/Sq Ft
Est. Value
About This Home
This home is located at 115 Pine Hill Ln, Heiskell, TN 37754 and is currently estimated at $353,791, approximately $283 per square foot. 115 Pine Hill Ln is a home located in Anderson County with nearby schools including Norris Middle School and Clinton High School.
Ownership History
Date
Name
Owned For
Owner Type
Purchase Details
Closed on
Dec 5, 2007
Sold by
Campbell Gregory Scott
Bought by
Flores William A
Current Estimated Value
Home Financials for this Owner
Home Financials are based on the most recent Mortgage that was taken out on this home.
Original Mortgage
$138,600
Outstanding Balance
$89,563
Interest Rate
6.22%
Estimated Equity
$264,228
Purchase Details
Closed on
Jun 21, 2007
Sold by
Campbell Jerissa Carolee
Bought by
Campbell Gregory Scott
Purchase Details
Closed on
Jun 12, 2000
Bought by
Campbell Gregory S
Purchase Details
Closed on
Oct 23, 1996
Sold by
Rocar Dev
Bought by
Campbell Gregory
Home Financials for this Owner
Home Financials are based on the most recent Mortgage that was taken out on this home.
Original Mortgage
$78,850
Interest Rate
8.15%
Purchase Details
Closed on
Jul 11, 1995
Sold by
Bayless Linda Bill
Bought by
Powers Richard
Purchase Details
Closed on
Jul 10, 1995
Bought by
Rocar Development
Create a Home Valuation Report for This Property
The Home Valuation Report is an in-depth analysis detailing your home's value as well as a comparison with similar homes in the area
Home Values in the Area
Average Home Value in this Area
Purchase History
| Date | Buyer | Sale Price | Title Company |
|---|---|---|---|
| Flores William A | $129,500 | -- | |
| Campbell Gregory Scott | -- | -- | |
| Campbell Gregory S | -- | -- | |
| Campbell Gregory | $83,000 | -- | |
| Powers Richard | $46,000 | -- | |
| Rocar Development | $15,000 | -- |
Source: Public Records
Mortgage History
| Date | Status | Borrower | Loan Amount |
|---|---|---|---|
| Open | Rocar Development | $138,600 | |
| Previous Owner | Rocar Development | $78,850 |
Source: Public Records
Tax History
| Year | Tax Paid | Tax Assessment Tax Assessment Total Assessment is a certain percentage of the fair market value that is determined by local assessors to be the total taxable value of land and additions on the property. | Land | Improvement |
|---|---|---|---|---|
| 2025 | $902 | $63,825 | $9,000 | $54,825 |
| 2024 | $902 | $34,325 | $6,200 | $28,125 |
| 2023 | $902 | $34,325 | $0 | $0 |
| 2022 | $902 | $34,325 | $6,200 | $28,125 |
| 2021 | $902 | $34,325 | $6,200 | $28,125 |
| 2020 | $820 | $34,325 | $6,200 | $28,125 |
| 2019 | $849 | $29,375 | $5,625 | $23,750 |
| 2018 | $820 | $29,375 | $5,625 | $23,750 |
| 2017 | $820 | $29,375 | $5,625 | $23,750 |
| 2016 | $820 | $29,375 | $5,625 | $23,750 |
| 2015 | -- | $29,375 | $5,625 | $23,750 |
| 2014 | -- | $29,375 | $5,625 | $23,750 |
| 2013 | -- | $32,850 | $0 | $0 |
Source: Public Records
Map
Nearby Homes
- 9549 Heiskell Rd
- 1088 E Wolf Valley Rd
- 9851 Heiskell Rd
- 309 E Bullrun Valley Dr
- 893 Brushy Valley Rd
- 605 Brushy Valley Rd
- 160 Lone River Ln
- 227 Lone Ridge Ln
- 817 Vanessa Way
- 325 Lone Ridge Ln
- 0 E Raccoon Valley Dr Unit 1327973
- 9401 Susanne Ellen Way
- 864 Bullrun Valley Dr
- 218 Christin Dr
- 407 Eagle Bend Ln
- 400 Eagle Bend Ln
- 304 E Brushy Valley Dr
- 545 E Brushy Valley Dr
- 9513 Diggs Gap Rd
- 606 Eagle Bend Rd
- 117 Pine Hill Ln
- 112 Pine Hill Ln
- 103 Pine Hill Ln
- 108 Pine Hill Ln
- 121 Pine Hill Ln
- 102 Pine Hill Ln
- 125 Pine Hill Ln
- 1518 E Wolf Valley Rd
- 106 Pine Ridge Ln
- 122 Pine Ridge Ln
- 1520 E Wolf Valley Rd
- 126 Pine Ridge Ln
- 131 Pine Hill Ln
- 1420 E Wolf Valley Rd
- 134 Pine Ridge Ln
- 120 Pine Hill Ln
- 126 Pine Hill Ln
- 140 Pine Ridge Ln
- 111 Pine Ridge Ln
- 121 Pine Ridge Ln