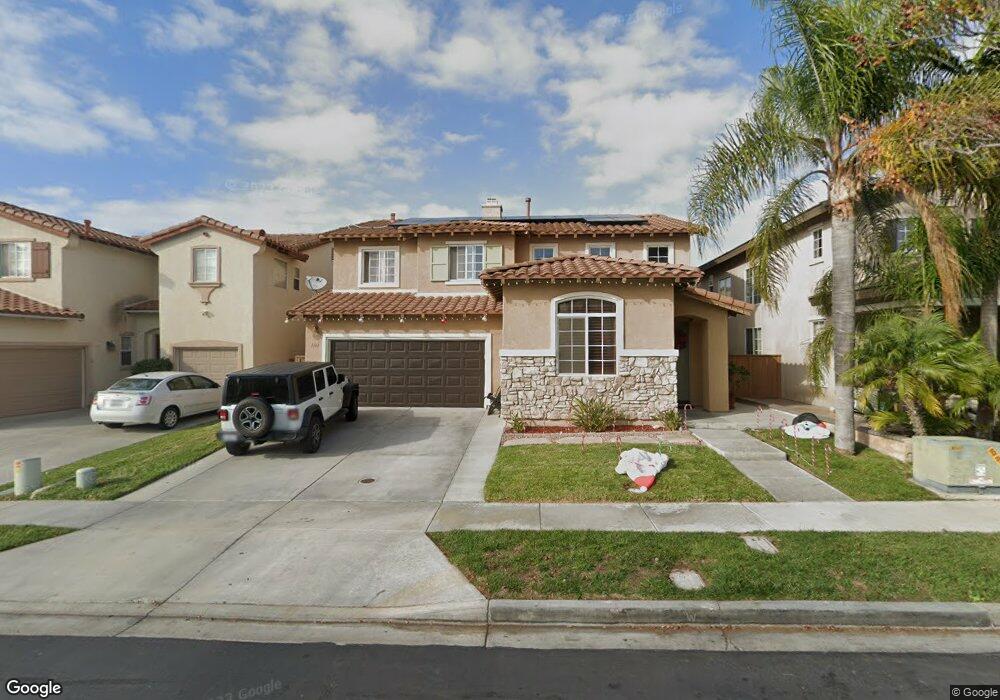
1161 Wind River Rd Chula Vista, CA 91913
Otay Ranch NeighborhoodEstimated Value: $1,035,000 - $1,067,035
4
Beds
3
Baths
2,462
Sq Ft
$428/Sq Ft
Est. Value
About This Home
This home is located at 1161 Wind River Rd, Chula Vista, CA 91913 and is currently estimated at $1,052,759, approximately $427 per square foot. 1161 Wind River Rd is a home located in San Diego County with nearby schools including Anne & William Hedenkamp Elementary School, Rancho Del Rey Middle School, and Otay Ranch Senior High School.
Ownership History
Date
Name
Owned For
Owner Type
Purchase Details
Closed on
Aug 8, 2025
Sold by
Placencia Rodolfo R and Plascencia Esther
Bought by
Plascencia Rodolfo R and Plascencia Esther
Current Estimated Value
Home Financials for this Owner
Home Financials are based on the most recent Mortgage that was taken out on this home.
Original Mortgage
$75,000
Outstanding Balance
$74,668
Interest Rate
6.67%
Mortgage Type
Credit Line Revolving
Estimated Equity
$978,091
Purchase Details
Closed on
Feb 5, 2016
Sold by
Placencia Rodolfo and Placencia Esther
Bought by
Placencia Rodolfo R and Placencia Esther
Purchase Details
Closed on
Dec 6, 2012
Sold by
Salvador Jericho G and Salvador Cynthia S
Bought by
Plascencia Rodolfo and Plascencia Cynthia Salcedo
Home Financials for this Owner
Home Financials are based on the most recent Mortgage that was taken out on this home.
Original Mortgage
$384,899
Interest Rate
3.33%
Mortgage Type
FHA
Purchase Details
Closed on
Jul 22, 2004
Sold by
Otay Ranch I West 1 Llc
Bought by
Salvador Jericho Galang and Salvador Cynthia Salcedo
Home Financials for this Owner
Home Financials are based on the most recent Mortgage that was taken out on this home.
Original Mortgage
$526,264
Interest Rate
1%
Mortgage Type
New Conventional
Create a Home Valuation Report for This Property
The Home Valuation Report is an in-depth analysis detailing your home's value as well as a comparison with similar homes in the area
Home Values in the Area
Average Home Value in this Area
Purchase History
| Date | Buyer | Sale Price | Title Company |
|---|---|---|---|
| Plascencia Rodolfo R | -- | Wfg National Title | |
| Placencia Rodolfo R | -- | Orange Coast Title Co Socal | |
| Plascencia Rodolfo | $392,000 | California Title Company | |
| Salvador Jericho Galang | $658,000 | Fidelity National Title |
Source: Public Records
Mortgage History
| Date | Status | Borrower | Loan Amount |
|---|---|---|---|
| Open | Plascencia Rodolfo R | $75,000 | |
| Previous Owner | Plascencia Rodolfo | $384,899 | |
| Previous Owner | Salvador Jericho Galang | $526,264 |
Source: Public Records
Tax History
| Year | Tax Paid | Tax Assessment Tax Assessment Total Assessment is a certain percentage of the fair market value that is determined by local assessors to be the total taxable value of land and additions on the property. | Land | Improvement |
|---|---|---|---|---|
| 2025 | $8,983 | $482,706 | $193,081 | $289,625 |
| 2024 | $8,983 | $473,243 | $189,296 | $283,947 |
| 2023 | $8,862 | $463,965 | $185,585 | $278,380 |
| 2022 | $8,674 | $454,869 | $181,947 | $272,922 |
| 2021 | $8,529 | $445,951 | $178,380 | $267,571 |
| 2020 | $8,360 | $441,379 | $176,551 | $264,828 |
| 2019 | $8,177 | $432,726 | $173,090 | $259,636 |
| 2018 | $8,043 | $424,243 | $169,697 | $254,546 |
| 2017 | $13 | $415,925 | $166,370 | $249,555 |
| 2016 | $7,617 | $407,770 | $163,108 | $244,662 |
| 2015 | $7,438 | $401,645 | $160,658 | $240,987 |
| 2014 | $7,536 | $393,778 | $157,511 | $236,267 |
Source: Public Records
Map
Nearby Homes
- 1156 Tristan River Rd
- 1405 Carneros Valley St
- 1004 Red Granite Rd
- 1532 Painted Cave Ave
- 1512 Donze Ave
- 1286 Wheatland St
- 972 Merced River Rd
- 1457 Fieldbrook St
- 1461 Fieldbrook St
- 1345 Santa Diana Rd
- 1508 Carpinteria St
- 1441 Santa Lucia Rd Unit 615
- 940 Sullivan Ct
- 1395 Santa Diana Rd Unit 3
- 1519 Taber Dr
- 1724 Santa Christina Ave Unit 1
- 1095 Paseo Entrada
- 1720 Santa Ivy Ave
- 1481 Pershing Rd
- 857 Cheyne Loop Unit 3
- 1157 Wind River Rd
- 1165 Wind River Rd
- 1169 Wind River Rd
- 1176 Tristan River Rd
- 1153 Wind River Rd
- 1173 Wind River Rd
- 1149 Wind River Rd
- 1180 Tristan River Rd
- 1162 Wind River Rd
- 1166 Wind River Rd
- 1168 Tristan River Rd
- 1172 Tristan River Rd
- 1158 Wind River Rd
- 1152 Tristan River Rd
- 1164 Tristan River Rd
- 1170 Wind River Rd
- 1154 Wind River Rd
- 1184 Tristan River Rd
- 1177 Wind River Rd
- 1145 Wind River Rd
Your Personal Tour Guide
Ask me questions while you tour the home.