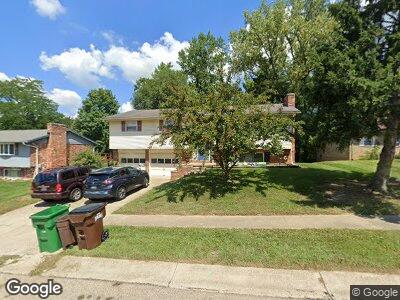
117 Morgan Ct Franklin, OH 45005
Estimated Value: $252,863 - $275,000
3
Beds
2
Baths
1,421
Sq Ft
$186/Sq Ft
Est. Value
About This Home
This home is located at 117 Morgan Ct, Franklin, OH 45005 and is currently estimated at $264,216, approximately $185 per square foot. 117 Morgan Ct is a home located in Warren County with nearby schools including Franklin High School and The CinDay Academy.
Ownership History
Date
Name
Owned For
Owner Type
Purchase Details
Closed on
Aug 6, 2008
Sold by
Emmons Harley Ray and Emmons Susan
Bought by
Cross Paula M
Current Estimated Value
Home Financials for this Owner
Home Financials are based on the most recent Mortgage that was taken out on this home.
Original Mortgage
$136,226
Interest Rate
6.39%
Mortgage Type
FHA
Purchase Details
Closed on
Oct 4, 2006
Sold by
Emmons Harley Ray
Bought by
Cross Paula M
Home Financials for this Owner
Home Financials are based on the most recent Mortgage that was taken out on this home.
Original Mortgage
$127,000
Interest Rate
6.41%
Mortgage Type
Seller Take Back
Purchase Details
Closed on
Apr 7, 2004
Sold by
Emmons Harley Ray
Bought by
Daley Claudia Jean
Home Financials for this Owner
Home Financials are based on the most recent Mortgage that was taken out on this home.
Original Mortgage
$107,900
Interest Rate
6.25%
Mortgage Type
Purchase Money Mortgage
Purchase Details
Closed on
Jan 3, 1992
Sold by
Strohman Bernard J and Strohman Jun
Bought by
Huber and Huber Lisa J
Purchase Details
Closed on
May 10, 1979
Sold by
Du Vall and Du Don G
Create a Home Valuation Report for This Property
The Home Valuation Report is an in-depth analysis detailing your home's value as well as a comparison with similar homes in the area
Home Values in the Area
Average Home Value in this Area
Purchase History
| Date | Buyer | Sale Price | Title Company |
|---|---|---|---|
| Cross Paula M | $139,000 | Landamerica | |
| Cross Paula M | $139,000 | None Available | |
| Daley Claudia Jean | $143,900 | -- | |
| Emmons Harley Ray | $134,900 | City Title Agency | |
| Huber | $87,000 | -- | |
| -- | $57,000 | -- |
Source: Public Records
Mortgage History
| Date | Status | Borrower | Loan Amount |
|---|---|---|---|
| Open | Cross Paula M | $134,259 | |
| Closed | Cross Paula M | $136,226 | |
| Previous Owner | Cross Paula M | $127,000 | |
| Previous Owner | Emmons Harley Ray | $107,900 | |
| Previous Owner | Daley Claudia Jean | $131,700 |
Source: Public Records
Tax History Compared to Growth
Tax History
| Year | Tax Paid | Tax Assessment Tax Assessment Total Assessment is a certain percentage of the fair market value that is determined by local assessors to be the total taxable value of land and additions on the property. | Land | Improvement |
|---|---|---|---|---|
| 2024 | $3,222 | $67,540 | $17,500 | $50,040 |
| 2023 | $2,891 | $55,118 | $10,762 | $44,355 |
| 2022 | $2,836 | $55,118 | $10,763 | $44,356 |
| 2021 | $2,688 | $55,118 | $10,763 | $44,356 |
| 2020 | $2,478 | $44,811 | $8,750 | $36,061 |
| 2019 | $2,254 | $44,811 | $8,750 | $36,061 |
| 2018 | $2,223 | $44,811 | $8,750 | $36,061 |
| 2017 | $2,122 | $38,535 | $7,648 | $30,888 |
| 2016 | $2,163 | $38,535 | $7,648 | $30,888 |
| 2015 | $2,163 | $38,535 | $7,648 | $30,888 |
| 2014 | $2,219 | $38,540 | $7,650 | $30,890 |
| 2013 | $1,881 | $44,090 | $8,750 | $35,340 |
Source: Public Records
Map
Nearby Homes
- 215 E Bryant Ave
- 103 Warren Ave
- 315 Bridge St
- 931 Virginia Ave
- 52 Ruppert Ct
- 41 Ruppert Ct
- 10 S River St
- 8810 Cam Dr
- 22 High St
- 260 Holly Dr
- 417 Spring Ave
- 143 Timber Ridge Dr
- 759 David Blvd
- 1501 Knightsbridge Ct
- 611 Meadowview Ct
- 418 Park Ave
- 137 Dalton Ave
- 0 Union Rd
- 142 Willard Ave
- 153 Arthur Ave