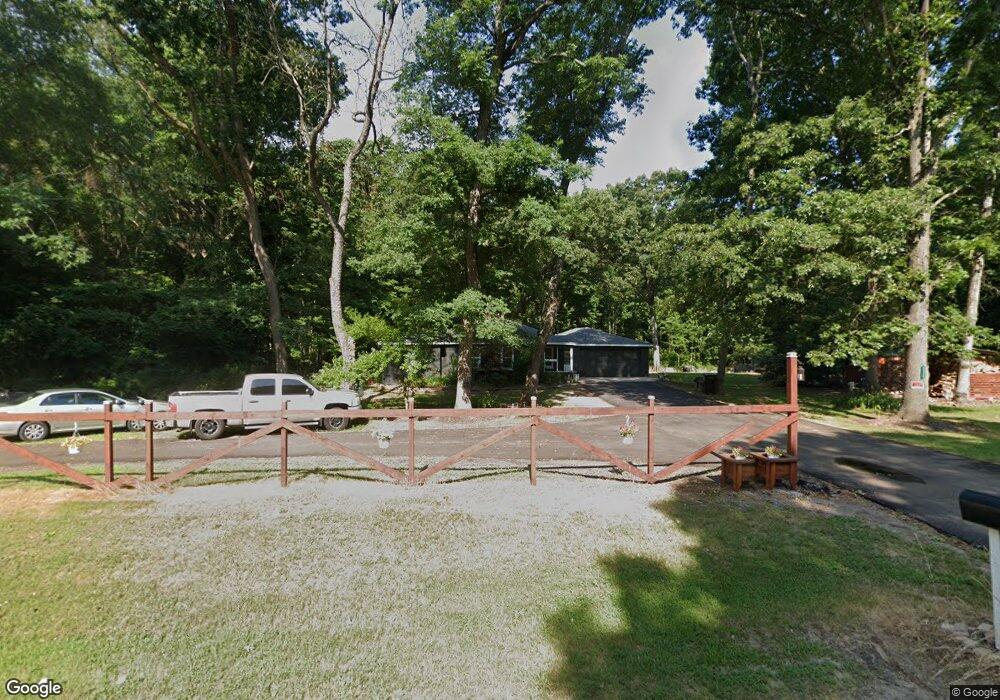
1172 56th St Pullman, MI 49450
Estimated Value: $140,000 - $209,000
3
Beds
1
Bath
1,059
Sq Ft
$159/Sq Ft
Est. Value
About This Home
This home is located at 1172 56th St, Pullman, MI 49450 and is currently estimated at $168,188, approximately $158 per square foot. 1172 56th St is a home located in Allegan County with nearby schools including Bloomingdale High School.
Ownership History
Date
Name
Owned For
Owner Type
Purchase Details
Closed on
Jan 13, 2020
Sold by
Sanchez German and Sanchez Kimberly L
Bought by
Huipe Rojas Abraham and Huipe Rojas Maria Cruz
Current Estimated Value
Purchase Details
Closed on
Jan 4, 2017
Sold by
Medrano Cruz
Bought by
Sanchez German and Sanchez Kimberly
Purchase Details
Closed on
Jun 30, 2008
Sold by
Rbs Citizens Na and Emerling Michael J
Bought by
Medrano Cruz
Purchase Details
Closed on
Dec 4, 2007
Sold by
Citimortgage Inc
Bought by
Charter One Bank
Purchase Details
Closed on
Nov 16, 2006
Sold by
Pantoja Gloria and Pantoja Elias
Bought by
Abn Amro Mortgage Group Inc
Purchase Details
Closed on
Oct 13, 1999
Sold by
Pantoja Elias
Bought by
Pantoja Elias and Pantoja Gloria A
Home Financials for this Owner
Home Financials are based on the most recent Mortgage that was taken out on this home.
Original Mortgage
$59,400
Interest Rate
7.02%
Purchase Details
Closed on
Dec 29, 1998
Sold by
Zwart Paul and Ung Tong
Bought by
Pantoja Elias
Create a Home Valuation Report for This Property
The Home Valuation Report is an in-depth analysis detailing your home's value as well as a comparison with similar homes in the area
Purchase History
| Date | Buyer | Sale Price | Title Company |
|---|---|---|---|
| Huipe Rojas Abraham | -- | None Available | |
| Sanchez German | -- | None Available | |
| Medrano Cruz | $41,000 | Sun Title Agency Llc | |
| Charter One Bank | -- | None Available | |
| Abn Amro Mortgage Group Inc | $73,991 | None Available | |
| Pantoja Elias | -- | Metropolitan Title Company | |
| Pantoja Elias | $69,900 | Metropolitan Title Company | |
| Pantoja Elias | -- | -- | |
| Pantoja Elias | $69,000 | -- |
Source: Public Records
Mortgage History
| Date | Status | Borrower | Loan Amount |
|---|---|---|---|
| Previous Owner | Pantoja Elias | $59,400 |
Source: Public Records
Tax History
| Year | Tax Paid | Tax Assessment Tax Assessment Total Assessment is a certain percentage of the fair market value that is determined by local assessors to be the total taxable value of land and additions on the property. | Land | Improvement |
|---|---|---|---|---|
| 2025 | $2,208 | $61,500 | $16,800 | $44,700 |
| 2024 | $1,742 | $68,500 | $20,500 | $48,000 |
| 2023 | $1,742 | $63,900 | $12,900 | $51,000 |
| 2022 | $1,742 | $45,300 | $11,700 | $33,600 |
| 2020 | $1,728 | $32,300 | $10,700 | $21,600 |
| 2019 | $1,814 | $34,600 | $10,700 | $23,900 |
| 2018 | $0 | $38,900 | $10,200 | $28,700 |
| 2017 | $0 | $27,500 | $9,500 | $18,000 |
| 2016 | $0 | $28,600 | $9,000 | $19,600 |
| 2015 | -- | $28,600 | $9,000 | $19,600 |
| 2014 | -- | $30,200 | $9,000 | $21,200 |
| 2013 | -- | $30,500 | $8,600 | $21,900 |
Source: Public Records
Map
Nearby Homes
Your Personal Tour Guide
Ask me questions while you tour the home.