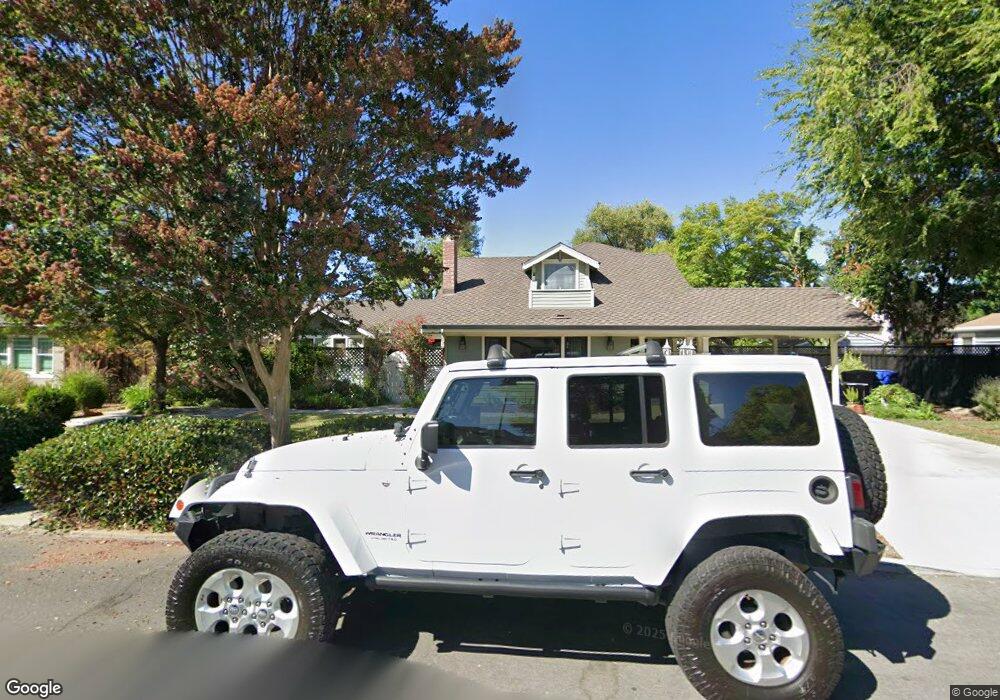
119 Alice Ave Campbell, CA 95008
Downtown Campbell NeighborhoodEstimated Value: $2,701,000 - $3,992,567
3
Beds
2
Baths
2,400
Sq Ft
$1,365/Sq Ft
Est. Value
About This Home
This home is located at 119 Alice Ave, Campbell, CA 95008 and is currently estimated at $3,276,392, approximately $1,365 per square foot. 119 Alice Ave is a home located in Santa Clara County with nearby schools including Del Mar High School, Campbell School of Innovation, and Capri Elementary.
Ownership History
Date
Name
Owned For
Owner Type
Purchase Details
Closed on
Sep 20, 2021
Sold by
Lee Jason M and Lee Kristine
Bought by
Lee Jason M and Lee Kristine
Current Estimated Value
Purchase Details
Closed on
Dec 29, 2015
Sold by
Mcfarland William F and Mcfarland Lili
Bought by
Lee Jason M and Lee Kristine
Home Financials for this Owner
Home Financials are based on the most recent Mortgage that was taken out on this home.
Original Mortgage
$450,000
Interest Rate
3.94%
Mortgage Type
New Conventional
Purchase Details
Closed on
Jun 16, 2004
Sold by
Mcfarland William F
Bought by
Mcfarland William F and Mcfarland Lili
Purchase Details
Closed on
Nov 17, 1998
Sold by
Mcfarland Lillian Rose Schonig
Bought by
Mcfarland William F
Home Financials for this Owner
Home Financials are based on the most recent Mortgage that was taken out on this home.
Original Mortgage
$430,100
Interest Rate
6.42%
Purchase Details
Closed on
Oct 27, 1998
Sold by
Atkinson J D and Atkinson Kay S
Bought by
Mcfarland William F
Home Financials for this Owner
Home Financials are based on the most recent Mortgage that was taken out on this home.
Original Mortgage
$430,100
Interest Rate
6.42%
Create a Home Valuation Report for This Property
The Home Valuation Report is an in-depth analysis detailing your home's value as well as a comparison with similar homes in the area
Home Values in the Area
Average Home Value in this Area
Purchase History
| Date | Buyer | Sale Price | Title Company |
|---|---|---|---|
| Lee Jason M | -- | None Listed On Document | |
| Lee Jason M | $1,500,000 | Old Republic Title Company | |
| Mcfarland William F | -- | -- | |
| Mcfarland William F | -- | Stewart Title | |
| Mcfarland William F | $538,000 | Stewart Title |
Source: Public Records
Mortgage History
| Date | Status | Borrower | Loan Amount |
|---|---|---|---|
| Previous Owner | Lee Jason M | $450,000 | |
| Previous Owner | Mcfarland William F | $430,100 |
Source: Public Records
Tax History Compared to Growth
Tax History
| Year | Tax Paid | Tax Assessment Tax Assessment Total Assessment is a certain percentage of the fair market value that is determined by local assessors to be the total taxable value of land and additions on the property. | Land | Improvement |
|---|---|---|---|---|
| 2025 | $31,181 | $2,555,989 | $1,242,984 | $1,313,005 |
| 2024 | $31,181 | $2,505,872 | $1,218,612 | $1,287,260 |
| 2023 | $28,291 | $2,254,238 | $1,194,718 | $1,059,520 |
| 2022 | $21,520 | $1,673,274 | $1,171,293 | $501,981 |
| 2021 | $21,145 | $1,640,466 | $1,148,327 | $492,139 |
| 2020 | $20,603 | $1,623,646 | $1,136,553 | $487,093 |
| 2019 | $20,326 | $1,591,811 | $1,114,268 | $477,543 |
| 2018 | $19,699 | $1,560,600 | $1,092,420 | $468,180 |
| 2017 | $19,431 | $1,530,000 | $1,071,000 | $459,000 |
| 2016 | $9,148 | $711,941 | $583,490 | $128,451 |
| 2015 | $8,990 | $701,248 | $574,726 | $126,522 |
| 2014 | $8,668 | $687,512 | $563,468 | $124,044 |
Source: Public Records
Map
Nearby Homes
- 195 Sunnyside Ave
- 186 E Rincon Ave
- 63 Braxton Terrace
- 120 Kennedy Ave
- 238 Railway Ave
- 110 S 1st St Unit 110
- 21 N 2nd St Unit 306
- 21 N 2nd St Unit 303
- 99 Timber Cove Dr Unit 99
- 253 W Rincon Ave
- 203 Wilton Dr
- 88 La Paz Way Unit 88
- 26 Timber Cove Dr Unit 26
- 353 W Rincon Ave Unit E
- 283 Esther Ave
- 178 Salmar Terrace
- 185 Union Ave Unit 16
- 722 Duncanville Ct
- 375 N 3rd St Unit 3
- 665 Hawthorne Ave