
119 W Concord St Unit 1 Boston, MA 02118
South End Neighborhood
3
Beds
3
Baths
1,780
Sq Ft
1,742
Sq Ft Lot
About This Home
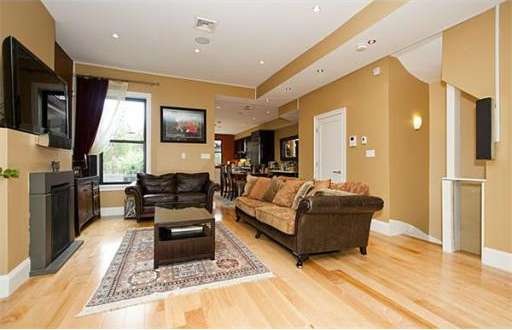
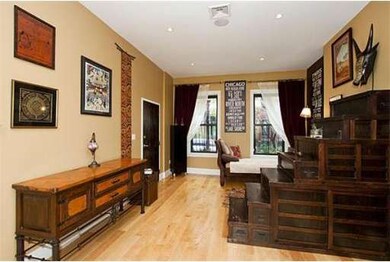
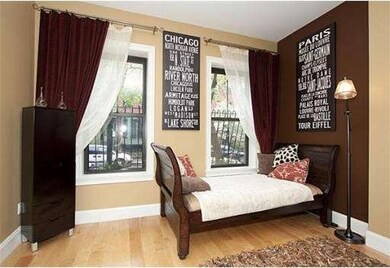
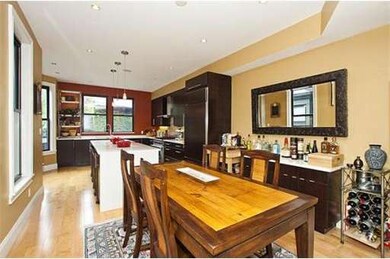
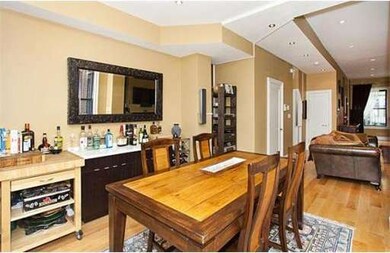
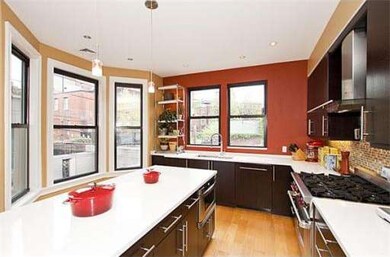
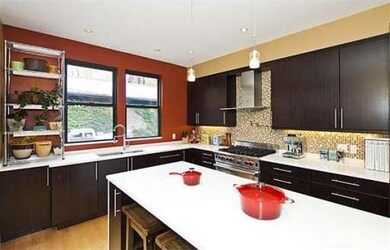
As of July 2023Absolutely stunning 3 bedroom/2-1/2 bath duplex features wide open living level with high ceilings, fireplace, many oversized windows and 4" maple floors. Unrivaled top-of-the-line center island kitchen with gorgeous Wenge cabinets has breakfast bar and windows on two sides including bay window. Lower level features lovely master suite, generous 2nd bedroom plus smaller nursery or home office. Impeccably renovated baths, and step out to garden patio and deeded parking.
Last Agent to Sell the Property
Keller Williams Realty Boston-Metro | Back Bay Listed on: 04/26/2012
Property Details
Home Type
Condominium
Est. Annual Taxes
$21,298
Year Built
1875
Lot Details
0
Listing Details
- Unit Level: 1
- Unit Placement: Street
- Special Features: None
- Property Sub Type: Condos
- Year Built: 1875
Interior Features
- Has Basement: No
- Fireplaces: 1
- Primary Bathroom: Yes
- Number of Rooms: 5
- Amenities: Public Transportation, Shopping, Park
Garage/Parking
- Parking Spaces: 1
Utilities
- Utility Connections: for Gas Range
Condo/Co-op/Association
- Association Fee Includes: Water, Sewer, Master Insurance, Exterior Maintenance
- Association Pool: No
- Management: Owner Association
- Pets Allowed: Yes w/ Restrictions (See Remarks)
- No Units: 2
- Unit Building: 1
Ownership History
Date
Name
Owned For
Owner Type
Purchase Details
Closed on
May 13, 2024
Sold by
Govey Christopher G and Govey Taryn I
Bought by
Govey Ft and Govey
Current Estimated Value
Purchase Details
Listed on
May 10, 2023
Closed on
Jul 26, 2023
Sold by
Kenary James B and Kenary Blair H
Bought by
Govey Christopher G and Govey Taryn I
Seller's Agent
Joe Cunningham
Compass
Buyer's Agent
The Biega + Kilgore Team
Compass
List Price
$2,175,000
Sold Price
$2,185,000
Premium/Discount to List
$10,000
0.46%
Views
65
Home Financials for this Owner
Home Financials are based on the most recent Mortgage that was taken out on this home.
Avg. Annual Appreciation
0.71%
Original Mortgage
$1,966,500
Interest Rate
6.13%
Mortgage Type
Purchase Money Mortgage
Purchase Details
Listed on
May 1, 2018
Closed on
Aug 17, 2018
Sold by
King Allison K and King Jeremy
Bought by
Kenary 4Th James B and Kenary Blair H
Seller's Agent
Rene Rodriguez
Cabot & Company
Buyer's Agent
Olinto/ Cunningham
Compass
List Price
$1,825,000
Sold Price
$1,625,000
Premium/Discount to List
-$200,000
-10.96%
Home Financials for this Owner
Home Financials are based on the most recent Mortgage that was taken out on this home.
Avg. Annual Appreciation
6.18%
Original Mortgage
$1,300,000
Interest Rate
3.6%
Mortgage Type
Purchase Money Mortgage
Purchase Details
Closed on
Jun 10, 2009
Sold by
Jjg Re Ventures Llc
Bought by
Olivero Anthony D
Home Financials for this Owner
Home Financials are based on the most recent Mortgage that was taken out on this home.
Original Mortgage
$740,000
Interest Rate
4.82%
Mortgage Type
Purchase Money Mortgage
Purchase Details
Closed on
Apr 14, 2009
Sold by
Whalen Stephen
Bought by
Jjg Rlest Ventures Llc
Home Financials for this Owner
Home Financials are based on the most recent Mortgage that was taken out on this home.
Original Mortgage
$740,000
Interest Rate
4.82%
Mortgage Type
Purchase Money Mortgage
Similar Homes in the area
Create a Home Valuation Report for This Property
The Home Valuation Report is an in-depth analysis detailing your home's value as well as a comparison with similar homes in the area
Home Values in the Area
Average Home Value in this Area
Purchase History
| Date | Type | Sale Price | Title Company |
|---|---|---|---|
| Quit Claim Deed | -- | None Available | |
| Quit Claim Deed | -- | None Available | |
| Quit Claim Deed | -- | None Available | |
| Quit Claim Deed | -- | None Available | |
| Condominium Deed | $2,185,000 | None Available | |
| Condominium Deed | $2,185,000 | None Available | |
| Deed | $1,625,000 | -- | |
| Deed | $1,625,000 | -- | |
| Deed | $925,000 | -- | |
| Deed | $925,000 | -- | |
| Deed | -- | -- | |
| Deed | -- | -- |
Source: Public Records
Mortgage History
| Date | Status | Loan Amount | Loan Type |
|---|---|---|---|
| Previous Owner | $1,966,500 | Purchase Money Mortgage | |
| Previous Owner | $1,274,000 | Adjustable Rate Mortgage/ARM | |
| Previous Owner | $1,300,000 | Purchase Money Mortgage | |
| Previous Owner | $355,000 | Closed End Mortgage | |
| Previous Owner | $810,000 | Purchase Money Mortgage | |
| Previous Owner | $740,000 | Purchase Money Mortgage |
Source: Public Records
Property History
| Date | Event | Price | Change | Sq Ft Price |
|---|---|---|---|---|
| 07/26/2023 07/26/23 | Sold | $2,185,000 | +0.5% | $1,228 / Sq Ft |
| 05/13/2023 05/13/23 | Pending | -- | -- | -- |
| 05/10/2023 05/10/23 | For Sale | $2,175,000 | +33.8% | $1,222 / Sq Ft |
| 08/17/2018 08/17/18 | Sold | $1,625,000 | -4.1% | $913 / Sq Ft |
| 07/23/2018 07/23/18 | Pending | -- | -- | -- |
| 06/18/2018 06/18/18 | Price Changed | $1,695,000 | -4.8% | $952 / Sq Ft |
| 05/10/2018 05/10/18 | Price Changed | $1,780,000 | -2.5% | $1,000 / Sq Ft |
| 05/01/2018 05/01/18 | For Sale | $1,825,000 | +73.8% | $1,025 / Sq Ft |
| 07/15/2012 07/15/12 | Sold | $1,050,000 | -8.7% | $590 / Sq Ft |
| 05/25/2012 05/25/12 | Pending | -- | -- | -- |
| 04/26/2012 04/26/12 | For Sale | $1,150,000 | -- | $646 / Sq Ft |
Source: MLS Property Information Network (MLS PIN)
Tax History Compared to Growth
Tax History
| Year | Tax Paid | Tax Assessment Tax Assessment Total Assessment is a certain percentage of the fair market value that is determined by local assessors to be the total taxable value of land and additions on the property. | Land | Improvement |
|---|---|---|---|---|
| 2025 | $21,298 | $1,839,200 | $0 | $1,839,200 |
| 2024 | $19,331 | $1,773,500 | $0 | $1,773,500 |
| 2023 | $18,667 | $1,738,100 | $0 | $1,738,100 |
| 2022 | $18,727 | $1,721,200 | $0 | $1,721,200 |
| 2021 | $18,006 | $1,687,500 | $0 | $1,687,500 |
| 2020 | $16,312 | $1,544,700 | $0 | $1,544,700 |
| 2019 | $15,803 | $1,499,300 | $0 | $1,499,300 |
| 2018 | $14,818 | $1,413,900 | $0 | $1,413,900 |
| 2017 | $14,260 | $1,346,600 | $0 | $1,346,600 |
| 2016 | $14,243 | $1,294,800 | $0 | $1,294,800 |
| 2015 | $14,497 | $1,197,100 | $0 | $1,197,100 |
| 2014 | $13,663 | $1,086,100 | $0 | $1,086,100 |
Source: Public Records
Agents Affiliated with this Home
-
Joe Cunningham
Seller's Agent in 2023
Joe Cunningham
Compass
(617) 206-3333
12 in this area
48 Total Sales
-
Cassie Comstock
C
Seller Co-Listing Agent in 2023
Cassie Comstock
Compass
(857) 230-0380
15 in this area
48 Total Sales
-
The Biega + Kilgore Team
Buyer's Agent in 2023
The Biega + Kilgore Team
Compass
(617) 504-7814
121 in this area
273 Total Sales
-
Rene Rodriguez
Seller's Agent in 2018
Rene Rodriguez
Cabot & Company
(617) 896-5006
15 in this area
43 Total Sales
-
O
Buyer's Agent in 2018
Olinto/ Cunningham
Compass
-
Steven Cohen Team
Seller's Agent in 2012
Steven Cohen Team
Keller Williams Realty Boston-Metro | Back Bay
(617) 861-3636
189 in this area
484 Total Sales
Map
Source: MLS Property Information Network (MLS PIN)
MLS Number: 71373354
APN: CBOS-000000-000009-000501-000012
Disclaimer: Certain information contained herein is derived from information provided by parties other than Homes.com. All information provided is deemed reliable, but is not guaranteed to be accurate and should be independently verified.
![]() The property listing data and information, or the Images, set forth herein were provided to MLS Property Information Network, Inc. from third party sources, including sellers, lessors and public records, and were compiled by MLS Property Information Network, Inc. The property listing data and information, and the Images, are for the personal, non-commercial use of consumers having a good faith interest in purchasing or leasing listed properties of the type displayed to them and may not be used for any purpose other than to identify prospective properties which such consumers may have a good faith interest in purchasing or leasing. MLS Property Information Network, Inc. and its subscribers disclaim any and all representations and warranties as to the accuracy of the property listing data and information, or as to the accuracy of any of the Images, set forth herein.
The property listing data and information, or the Images, set forth herein were provided to MLS Property Information Network, Inc. from third party sources, including sellers, lessors and public records, and were compiled by MLS Property Information Network, Inc. The property listing data and information, and the Images, are for the personal, non-commercial use of consumers having a good faith interest in purchasing or leasing listed properties of the type displayed to them and may not be used for any purpose other than to identify prospective properties which such consumers may have a good faith interest in purchasing or leasing. MLS Property Information Network, Inc. and its subscribers disclaim any and all representations and warranties as to the accuracy of the property listing data and information, or as to the accuracy of any of the Images, set forth herein.
Nearby Homes
- 2 Cumston St
- 1597 Washington St Unit 600
- 486 Shawmut Ave Unit 1
- 2 E Concord St Unit 1
- 43 W Newton St Unit 1-10
- 42 W Newton St Unit A25
- 116 W Concord St Unit 4
- 41 Worcester St Unit 2
- 51 Worcester St Unit 2
- 1666 Washington St Unit 3
- 1666 Washington St Unit 2
- 1682 Washington St Unit 8
- 99 W Springfield St
- 133 W Concord St Unit A
- 30-34 E Concord St Unit 16
- 8 Worcester Square Unit 2
- 94 W Springfield St Unit 1
- 520 Shawmut Ave Unit 1
- 69 Worcester St Unit 5
- 59 Rutland St Unit 3