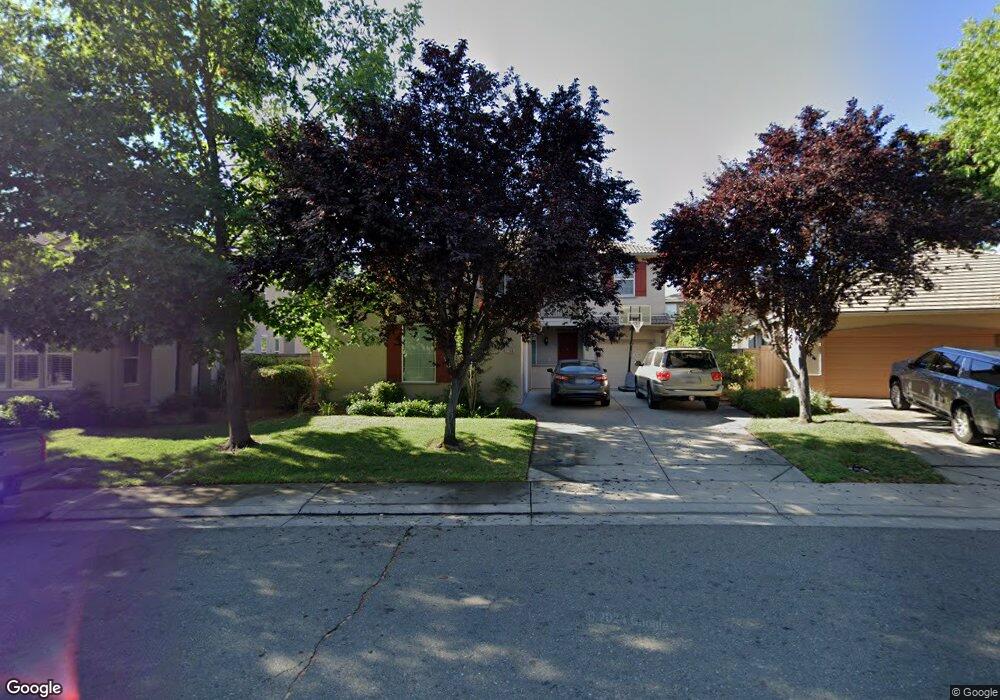
1195 Scheidegger Cir Folsom, CA 95630
The Parkway NeighborhoodEstimated Value: $800,000 - $920,000
4
Beds
2
Baths
2,420
Sq Ft
$356/Sq Ft
Est. Value
About This Home
This home is located at 1195 Scheidegger Cir, Folsom, CA 95630 and is currently estimated at $860,403, approximately $355 per square foot. 1195 Scheidegger Cir is a home located in Sacramento County with nearby schools including Oak Chan Elementary School, Folsom Middle School, and Vista Del Lago High School.
Ownership History
Date
Name
Owned For
Owner Type
Purchase Details
Closed on
Dec 9, 2009
Sold by
Garcia Jeff A
Bought by
Grinbergs Jeffrey and Grinbergs Jill
Current Estimated Value
Home Financials for this Owner
Home Financials are based on the most recent Mortgage that was taken out on this home.
Original Mortgage
$364,000
Interest Rate
4.91%
Mortgage Type
New Conventional
Purchase Details
Closed on
Sep 26, 2003
Sold by
Wl Homes Llc
Bought by
Garcia Jeff A
Home Financials for this Owner
Home Financials are based on the most recent Mortgage that was taken out on this home.
Original Mortgage
$312,247
Interest Rate
5.37%
Mortgage Type
Purchase Money Mortgage
Purchase Details
Closed on
Sep 25, 2003
Sold by
Garcia Brenda O
Bought by
Garcia Jeff A
Home Financials for this Owner
Home Financials are based on the most recent Mortgage that was taken out on this home.
Original Mortgage
$312,247
Interest Rate
5.37%
Mortgage Type
Purchase Money Mortgage
Create a Home Valuation Report for This Property
The Home Valuation Report is an in-depth analysis detailing your home's value as well as a comparison with similar homes in the area
Home Values in the Area
Average Home Value in this Area
Purchase History
| Date | Buyer | Sale Price | Title Company |
|---|---|---|---|
| Grinbergs Jeffrey | $455,000 | Chicago Title Company | |
| Garcia Jeff A | $390,500 | First American Title Ins Co | |
| Garcia Jeff A | -- | First American Title Co |
Source: Public Records
Mortgage History
| Date | Status | Borrower | Loan Amount |
|---|---|---|---|
| Previous Owner | Grinbergs Jeffrey | $364,000 | |
| Previous Owner | Garcia Jeff A | $312,247 | |
| Closed | Garcia Jeff A | $58,546 |
Source: Public Records
Tax History
| Year | Tax Paid | Tax Assessment Tax Assessment Total Assessment is a certain percentage of the fair market value that is determined by local assessors to be the total taxable value of land and additions on the property. | Land | Improvement |
|---|---|---|---|---|
| 2025 | $7,183 | $587,308 | $154,892 | $432,416 |
| 2024 | $7,183 | $575,793 | $151,855 | $423,938 |
| 2023 | $7,075 | $564,504 | $148,878 | $415,626 |
| 2022 | $6,982 | $553,436 | $145,959 | $407,477 |
| 2021 | $6,898 | $542,586 | $143,098 | $399,488 |
| 2020 | $6,832 | $537,023 | $141,631 | $395,392 |
| 2019 | $6,735 | $526,494 | $138,854 | $387,640 |
| 2018 | $6,601 | $516,172 | $136,132 | $380,040 |
| 2017 | $6,221 | $506,052 | $133,463 | $372,589 |
| 2016 | $6,358 | $475,851 | $147,447 | $328,404 |
| 2015 | $6,041 | $457,550 | $141,776 | $315,774 |
| 2014 | $5,787 | $448,578 | $138,996 | $309,582 |
Source: Public Records
Map
Nearby Homes
- 1160 Cobblefields Ct
- 1592 Thurman Way
- 1591 Bonanza Ln
- 1208 Souza Way
- 1484 Willow Bend Rd
- 104 Maderos Ct
- 1420 Folsom Meadows Cir N
- 1425 Humbug Creek Dr
- 401 Picasso Way Unit 401
- 1153 Fergusen Way
- 1047 Elsworth Way
- 4901 Esplanade Cir Unit 4901
- 1046 Smith Way
- 177 Dulverton Cir
- 1121 Elderberry Cir
- 1437 Cummings Way
- 1380 Quigley Ct
- 1381 Haddington Dr
- 1755 Langholm Way
- 105 Wolcot Ct
- 1199 Scheidegger Cir
- 1187 Scheidegger Cir
- 1514 Thurman Way
- 1194 Scheidegger Cir
- 1200 Scheidegger Cir
- 1518 Thurman Way
- 1188 Scheidegger Cir
- 1505 Thurman Way
- 1501 Thurman Way
- 1183 Scheidegger Cir
- 1509 Thurman Way
- 1204 Scheidegger Cir
- 1546 Kearns Ct
- 1513 Thurman Way
- 1182 Scheidegger Cir
- 1208 Scheidegger Cir
- 1517 Thurman Way
- 1542 Kearns Ct
- 1178 Scheidegger Cir
- 1526 Thurman Way
Your Personal Tour Guide
Ask me questions while you tour the home.