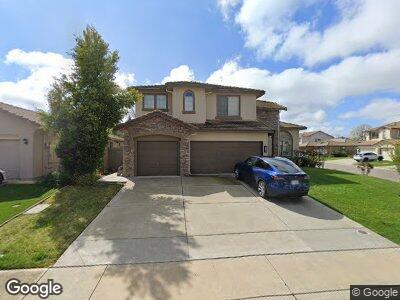
11956 Mandolin Way Rancho Cordova, CA 95742
Anatolia NeighborhoodEstimated Value: $670,000 - $767,000
4
Beds
3
Baths
2,885
Sq Ft
$250/Sq Ft
Est. Value
About This Home
This home is located at 11956 Mandolin Way, Rancho Cordova, CA 95742 and is currently estimated at $721,441, approximately $250 per square foot. 11956 Mandolin Way is a home located in Sacramento County with nearby schools including Robert J. McGarvey Elementary, Katherine L. Albiani Middle School, and Pleasant Grove High School.
Ownership History
Date
Name
Owned For
Owner Type
Purchase Details
Closed on
Mar 15, 2017
Sold by
Gilra Deepak and Gilra Nitisha
Bought by
Gilra Deepak Kumar and Gilra Nitisha
Current Estimated Value
Purchase Details
Closed on
Apr 14, 2009
Sold by
Us Bank National Association
Bought by
Gilra Deepak and Gilra Nitisha
Home Financials for this Owner
Home Financials are based on the most recent Mortgage that was taken out on this home.
Original Mortgage
$228,800
Interest Rate
4.71%
Mortgage Type
Purchase Money Mortgage
Purchase Details
Closed on
Jan 9, 2009
Sold by
Tran My Phuong and Truong Ngoc Diep Thi
Bought by
Us Bank National Association
Purchase Details
Closed on
Feb 3, 2006
Sold by
Jts Communities
Bought by
Tran My Phuong and Truong Ngoc Diep Thi
Home Financials for this Owner
Home Financials are based on the most recent Mortgage that was taken out on this home.
Original Mortgage
$549,342
Interest Rate
6.16%
Mortgage Type
Fannie Mae Freddie Mac
Create a Home Valuation Report for This Property
The Home Valuation Report is an in-depth analysis detailing your home's value as well as a comparison with similar homes in the area
Home Values in the Area
Average Home Value in this Area
Purchase History
| Date | Buyer | Sale Price | Title Company |
|---|---|---|---|
| Gilra Deepak Kumar | -- | None Available | |
| Gilra Deepak | $286,000 | Orange Coast Title | |
| Us Bank National Association | $335,000 | Accommodation | |
| Tran My Phuong | $610,500 | Placer Title Company |
Source: Public Records
Mortgage History
| Date | Status | Borrower | Loan Amount |
|---|---|---|---|
| Open | Gilra Deepak | $199,250 | |
| Closed | Gilra Deepak | $228,800 | |
| Previous Owner | Tran My Phuong | $549,342 | |
| Previous Owner | Jts Communities Inc | $100,000,000 |
Source: Public Records
Tax History Compared to Growth
Tax History
| Year | Tax Paid | Tax Assessment Tax Assessment Total Assessment is a certain percentage of the fair market value that is determined by local assessors to be the total taxable value of land and additions on the property. | Land | Improvement |
|---|---|---|---|---|
| 2024 | $6,584 | $365,222 | $107,304 | $257,918 |
| 2023 | $6,419 | $358,061 | $105,200 | $252,861 |
| 2022 | $6,235 | $347,041 | $103,138 | $243,903 |
| 2021 | $6,195 | $340,237 | $101,116 | $239,121 |
| 2020 | $6,101 | $336,750 | $100,080 | $236,670 |
| 2019 | $5,986 | $330,148 | $98,118 | $232,030 |
| 2018 | $5,826 | $323,676 | $96,195 | $227,481 |
| 2017 | $5,712 | $317,330 | $94,309 | $223,021 |
| 2016 | $5,618 | $311,109 | $92,460 | $218,649 |
| 2015 | $5,505 | $306,437 | $91,072 | $215,365 |
| 2014 | $5,402 | $300,436 | $89,289 | $211,147 |
Source: Public Records
Map
Nearby Homes
- 4317 Accordian Way
- 12013 Mircado Way
- 12015 Mircado Way
- 12098 Mircado Way
- 12024 Mircado Way
- 12030 Mircado Way
- 11896 Slate Falls Way
- 4316 Orpheus Cir
- 11833 Stoney Ridge Way
- 4348 Orpheus Cir
- 4347 Orpheus Cir
- 4321-4381 Anatolia Dr
- 4163 Cambery Dr
- 12028 Agen Cir
- 4155 Cambery Dr
- 12032 Agen Cir N
- 4252 Aura Way
- 4248 Aura Way
- 4244 Aura Way
- 12533 Wheat Ridge Dr
- 11956 Mandolin Way
- 11960 Mandolin Way
- 4309 Accordian Way
- 11966 Mandolin Way
- 4300 Accordian Way
- 4313 Accordian Way
- 4304 Accordian Way
- 11959 Mandolin Way
- 11955 Mandolin Way
- 4324 Stizzo Ct
- 11963 Mandolin Way
- 11951 Mandolin Way
- 4308 Accordian Way
- 11970 Mandolin Way
- 11967 Mandolin Way
- 11947 Mandolin Way
- 4322 Stizzo Ct
- 4312 Accordion Way
- 4312 Accordian Way
- 4328 Stizzo Ct