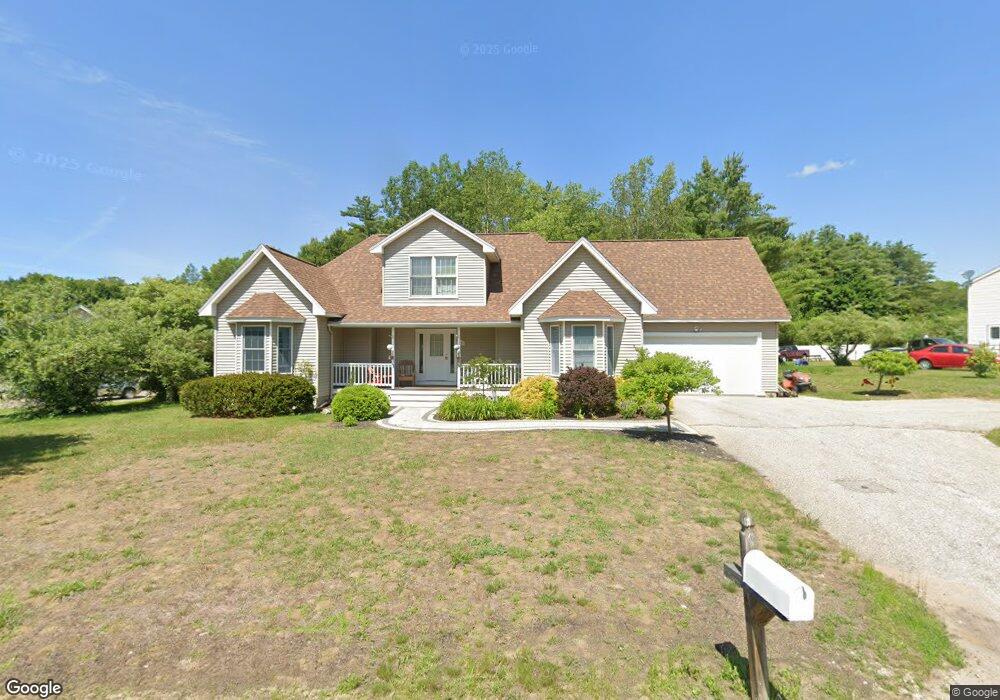
12 Pasture Dr Franklin, NH 03235
Estimated Value: $522,000 - $639,000
3
Beds
4
Baths
2,582
Sq Ft
$219/Sq Ft
Est. Value
About This Home
This home is located at 12 Pasture Dr, Franklin, NH 03235 and is currently estimated at $565,016, approximately $218 per square foot. 12 Pasture Dr is a home located in Merrimack County with nearby schools including Paul A. Smith School, Franklin Middle School, and Franklin High School.
Ownership History
Date
Name
Owned For
Owner Type
Purchase Details
Closed on
Apr 1, 2010
Sold by
Usa Va
Bought by
Rogers Suzanne M
Current Estimated Value
Purchase Details
Closed on
Dec 29, 2009
Sold by
Eldridge Jon W and Usa Va
Bought by
Usa Va
Purchase Details
Closed on
Apr 4, 2006
Sold by
Aldro Elizabeth M
Bought by
Eldridge Jon and Eldridge Cortney L
Home Financials for this Owner
Home Financials are based on the most recent Mortgage that was taken out on this home.
Original Mortgage
$270,000
Interest Rate
6.32%
Mortgage Type
Purchase Money Mortgage
Create a Home Valuation Report for This Property
The Home Valuation Report is an in-depth analysis detailing your home's value as well as a comparison with similar homes in the area
Home Values in the Area
Average Home Value in this Area
Purchase History
| Date | Buyer | Sale Price | Title Company |
|---|---|---|---|
| Rogers Suzanne M | $193,400 | -- | |
| Usa Va | $214,200 | -- | |
| Eldridge Jon | $270,000 | -- | |
| Eldridge Jon W | $270,000 | -- |
Source: Public Records
Mortgage History
| Date | Status | Borrower | Loan Amount |
|---|---|---|---|
| Previous Owner | Eldridge Jon W | $270,000 |
Source: Public Records
Tax History Compared to Growth
Tax History
| Year | Tax Paid | Tax Assessment Tax Assessment Total Assessment is a certain percentage of the fair market value that is determined by local assessors to be the total taxable value of land and additions on the property. | Land | Improvement |
|---|---|---|---|---|
| 2024 | $8,357 | $487,300 | $98,900 | $388,400 |
| 2023 | $7,923 | $487,300 | $98,900 | $388,400 |
| 2022 | $7,044 | $288,800 | $82,400 | $206,400 |
| 2021 | $6,703 | $288,800 | $82,400 | $206,400 |
| 2020 | $6,391 | $279,800 | $78,500 | $201,300 |
| 2019 | $6,287 | $279,800 | $78,500 | $201,300 |
| 2018 | $6,144 | $279,800 | $78,500 | $201,300 |
| 2017 | $4,977 | $194,700 | $31,300 | $163,400 |
| 2016 | $4,985 | $197,600 | $31,300 | $166,300 |
| 2015 | $3,451 | $138,320 | $21,910 | $116,410 |
| 2011 | -- | $241,200 | $38,800 | $202,400 |
Source: Public Records
Map
Nearby Homes