Estimated Value: $440,470 - $525,000
3
Beds
2
Baths
912
Sq Ft
$521/Sq Ft
Est. Value
About This Home
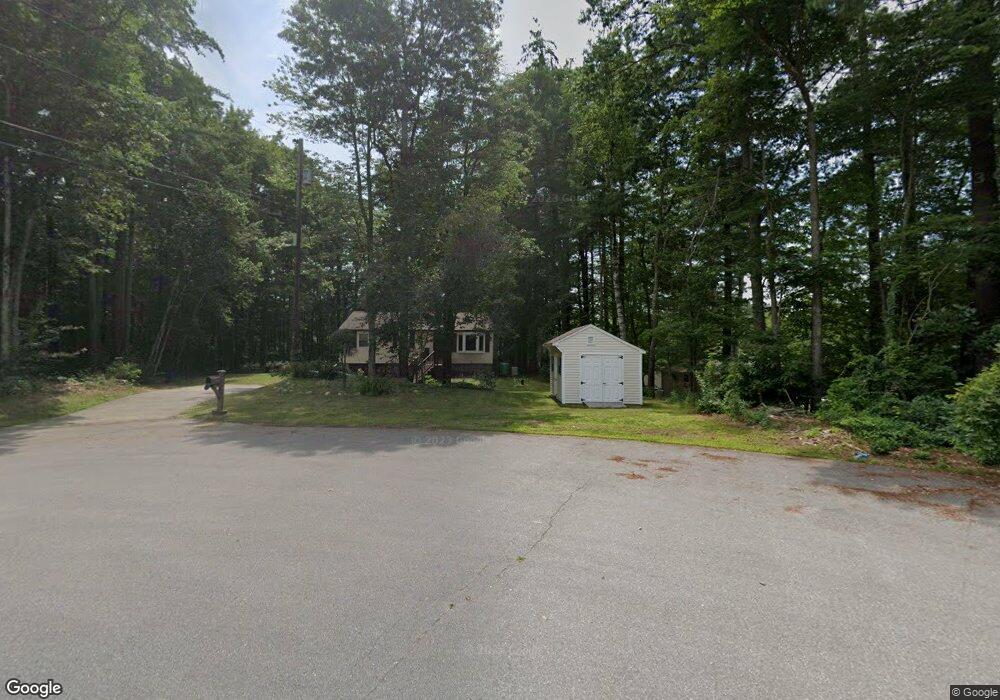
This home is located at 12 Viza Ave, Derry, NH 03038 and is currently estimated at $475,368, approximately $521 per square foot. 12 Viza Ave is a home located in Rockingham County with nearby schools including Ernest P. Barka Elementary School, Gilbert H. Hood Middle School, and Pinkerton Academy.
Ownership History
Date
Name
Owned For
Owner Type
Purchase Details
Closed on
Oct 16, 1996
Sold by
Waite John M and Waite Laurie J
Bought by
Middleton Ii James W and Middleton Corinna M
Current Estimated Value
Home Financials for this Owner
Home Financials are based on the most recent Mortgage that was taken out on this home.
Original Mortgage
$89,750
Interest Rate
8.26%
Create a Home Valuation Report for This Property
The Home Valuation Report is an in-depth analysis detailing your home's value as well as a comparison with similar homes in the area
Home Values in the Area
Average Home Value in this Area
Purchase History
| Date | Buyer | Sale Price | Title Company |
|---|---|---|---|
| Middleton Ii James W | $88,000 | -- |
Source: Public Records
Mortgage History
| Date | Status | Borrower | Loan Amount |
|---|---|---|---|
| Open | Middleton Ii James W | $220,000 | |
| Closed | Middleton Ii James W | $40,000 | |
| Closed | Middleton Ii James W | $89,750 |
Source: Public Records
Tax History Compared to Growth
Tax History
| Year | Tax Paid | Tax Assessment Tax Assessment Total Assessment is a certain percentage of the fair market value that is determined by local assessors to be the total taxable value of land and additions on the property. | Land | Improvement |
|---|---|---|---|---|
| 2024 | $7,461 | $399,200 | $210,300 | $188,900 |
| 2023 | $7,224 | $349,300 | $178,700 | $170,600 |
| 2022 | $6,651 | $349,300 | $178,700 | $170,600 |
| 2021 | $6,455 | $260,700 | $136,600 | $124,100 |
| 2020 | $6,345 | $260,700 | $136,600 | $124,100 |
| 2019 | $5,744 | $219,900 | $105,500 | $114,400 |
| 2018 | $5,724 | $219,900 | $105,500 | $114,400 |
| 2017 | $5,573 | $193,100 | $95,500 | $97,600 |
| 2016 | $5,225 | $193,100 | $95,500 | $97,600 |
| 2015 | $5,206 | $178,100 | $95,500 | $82,600 |
| 2014 | $5,240 | $178,100 | $95,500 | $82,600 |
| 2013 | $5,180 | $164,500 | $87,500 | $77,000 |
Source: Public Records
Map
Nearby Homes