120 Leonard Post Dr Buffalo, NY 14211
Central Cheektowaga NeighborhoodEstimated payment $1,392/month
Highlights
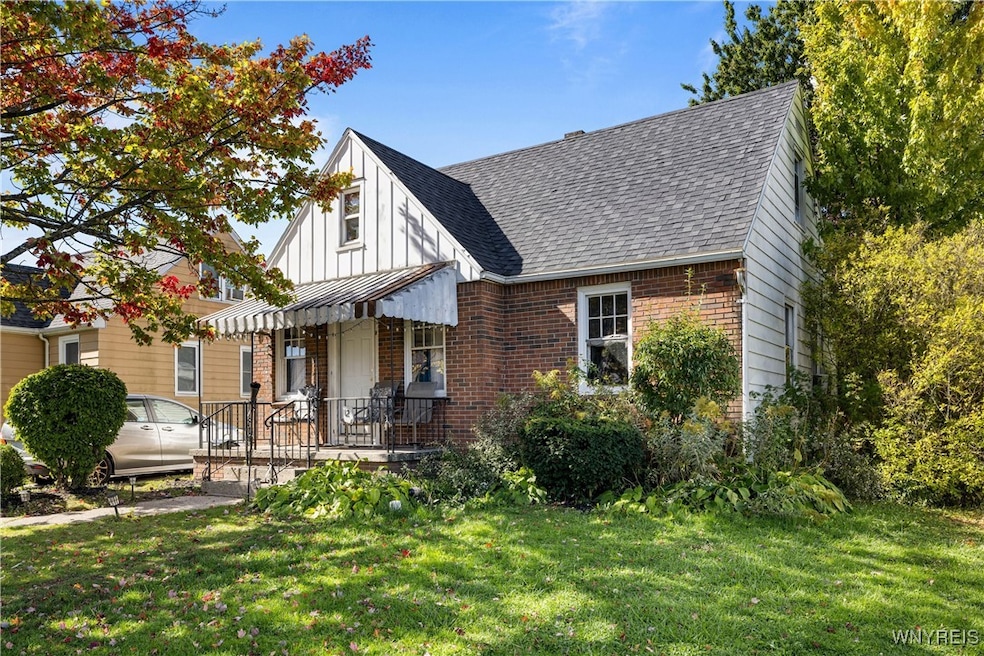
- Cape Cod Architecture
- Main Floor Bedroom
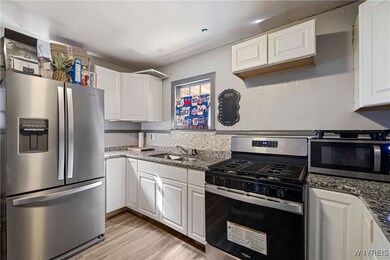
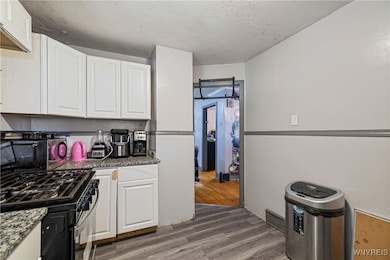
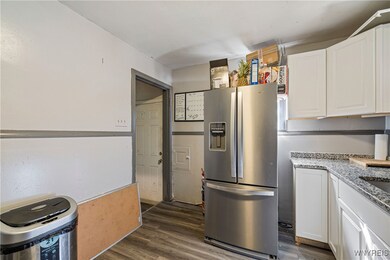
- Eat-In Kitchen
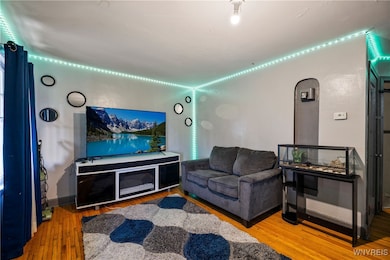
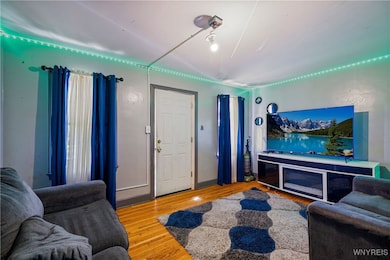
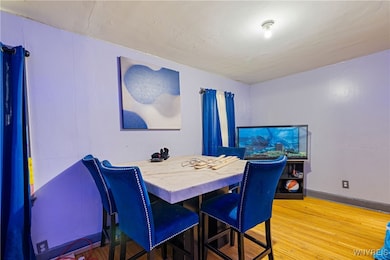
- Wood Flooring
- 1.5 Car Detached Garage
- Forced Air Heating System
About This Home
Enjoy this charming brick Cape Cod home, ideally located near the Galleria Mall, Walden Avenue, and Harlem Road—close to shopping, dining, and all amenities. Featuring a new roof and updated mechanicals, this well-maintained Cheektowaga home offers a comfortable and inviting layout. The private backyard provides a peaceful retreat, while the generously sized sunroom adds extra living space perfect for relaxing or entertaining.
Listing Agent
Listing by Symphony Real Estate LLC License #10401250032 Listed on: 10/16/2025
Home Details
Home Type
- Single Family
Est. Annual Taxes
- $4,663
Year Built
- Built in 1943
Lot Details
- 5,663 Sq Ft Lot
- Lot Dimensions are 52x111
- Rectangular Lot
Parking
- 1.5 Car Detached Garage
- Driveway
Home Design
- Cape Cod Architecture
- Brick Exterior Construction
- Block Foundation
- Wood Siding
Interior Spaces
- 1,164 Sq Ft Home
- 1-Story Property
- Basement Fills Entire Space Under The House
- Eat-In Kitchen
Flooring
- Wood
- Carpet
Bedrooms and Bathrooms
- 3 Bedrooms | 2 Main Level Bedrooms
- 1 Full Bathroom
Utilities
- Forced Air Heating System
- Heating System Uses Gas
- Gas Water Heater
Community Details
- Harlem Park Anx Subdivision
Listing and Financial Details
- Tax Lot 7
- Assessor Parcel Number 143089-102-460-0001-007-000
Map
Home Values in the Area
Average Home Value in this Area
Tax History
| Year | Tax Paid | Tax Assessment Tax Assessment Total Assessment is a certain percentage of the fair market value that is determined by local assessors to be the total taxable value of land and additions on the property. | Land | Improvement |
|---|---|---|---|---|
| 2024 | $4,454 | $137,000 | $10,000 | $127,000 |
| 2023 | $4,268 | $137,000 | $10,000 | $127,000 |
| 2022 | $4,039 | $137,000 | $10,000 | $127,000 |
| 2021 | $3,876 | $114,000 | $10,000 | $104,000 |
| 2020 | $3,292 | $72,700 | $9,800 | $62,900 |
| 2019 | $4,244 | $72,700 | $9,800 | $62,900 |
| 2018 | $3,138 | $72,700 | $9,800 | $62,900 |
| 2017 | $3,073 | $72,700 | $9,800 | $62,900 |
| 2016 | $2,907 | $70,200 | $9,800 | $60,400 |
| 2015 | -- | $70,200 | $9,800 | $60,400 |
| 2014 | -- | $70,200 | $9,800 | $60,400 |
Property History
| Date | Event | Price | List to Sale | Price per Sq Ft |
|---|---|---|---|---|
| 10/16/2025 10/16/25 | For Sale | $195,000 | -- | $168 / Sq Ft |
Purchase History
| Date | Type | Sale Price | Title Company |
|---|---|---|---|
| Bargain Sale Deed | $43,144 | None Available | |
| Foreclosure Deed | $90,998 | None Available | |
| Bargain Sale Deed | $32,055 | -- | |
| Bargain Sale Deed | -- | -- | |
| Deed | $53,500 | -- | |
| Deed | -- | -- |
Mortgage History
| Date | Status | Loan Amount | Loan Type |
|---|---|---|---|
| Previous Owner | $25,644 | Purchase Money Mortgage | |
| Previous Owner | $0 | FHA |
Source: Western New York Real Estate Information Services (WNYREIS)
MLS Number: B1645470
APN: 143089-102-460-0001-007-000
Disclaimer: Certain information contained herein is derived from information provided by parties other than Homes.com. All information provided is deemed reliable, but is not guaranteed to be accurate and should be independently verified.
![]() The data relating to real estate on this web site comes in part from the Internet Data Exchange (IDX) Program of the CNYIS, UNYREIS and WNYREIS. Real estate listings held by firms other than Homes.com, LLC are marked with the IDX logo and include the Listing Broker’s Firm Name.
The data relating to real estate on this web site comes in part from the Internet Data Exchange (IDX) Program of the CNYIS, UNYREIS and WNYREIS. Real estate listings held by firms other than Homes.com, LLC are marked with the IDX logo and include the Listing Broker’s Firm Name.
Disclaimer: All information deemed reliable but not guaranteed and should be independently verified. All properties
are subject to prior sale, change or withdrawal. Neither the listing broker(s) nor Homes.com, LLC shall be responsible for any typographical errors, misinformation, misprints, and shall be held totally harmless.
© 2026 CNYIS, UNYREIS, WNYREIS. All rights reserved.
- 15 Chopin Place
- 130 Reo Ave
- 62 Wanda Ave
- 64 Westchester Dr
- 35 Reo Ave
- 12 Leonard Post Dr
- 24 Ridge Park Ave
- 1311 Walden Ave
- 40 Hedwig Ave
- 88 Woodell Ave
- 37 Woodell Ave
- 144 Alexander Ave
- 1217 Walden Ave
- 50 Gualbert Ave
- 32 Eden Ln
- 105 Hoerner Ave
- 32 Wildy Ave
- 146 David Ave
- 280 Pine Ridge Rd
- 1089 Walden Ave
- 108 David Ave
- 65 Euclid Ave Unit 3
- 73 Randolph Ave Unit 2
- 2255 Genesee St
- 36 Crescent Ct
- 70 Ivanhoe Rd
- 25 Shelby Dr
- 125 Beryl Dr
- 40 Windwood Ct
- 36 Glenwood Ct Unit C
- 2445 Bailey Ave
- 238 Schiller St
- 71 Gerald Ave Unit Upper
- 171 Schiller St
- 171 Schiller St
- 1175 George Urban Blvd
- 94 Tudor Rd
- 226 Longnecker St
- 111 N Ogden St Unit E
- 35 Dorris Ave

Ask me questions while you tour the home.