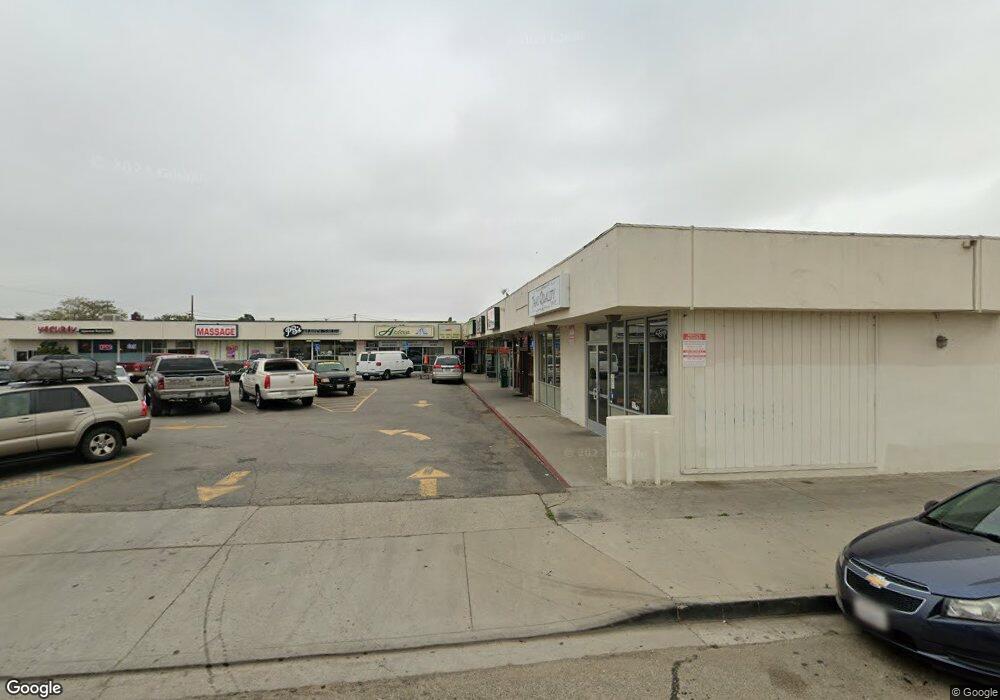
1201 Saviers Rd Unit 1213 Oxnard, CA 93033
Kamala Park NeighborhoodEstimated Value: $2,649,481
Studio
--
Bath
12,790
Sq Ft
$207/Sq Ft
Est. Value
About This Home
This home is located at 1201 Saviers Rd Unit 1213, Oxnard, CA 93033 and is currently estimated at $2,649,481, approximately $207 per square foot. 1201 Saviers Rd Unit 1213 is a home located in Ventura County with nearby schools including Elm Street Elementary School, R.J. Frank Academy of Marine Science & Engineering, and Hueneme High School.
Ownership History
Date
Name
Owned For
Owner Type
Purchase Details
Closed on
Nov 29, 2021
Sold by
Lee Family Trust
Bought by
Ljm Llc
Current Estimated Value
Purchase Details
Closed on
Nov 21, 2000
Sold by
Shin Alexander and Shin Sabrina
Bought by
Lee Suk Man and Lee Eun Sook
Home Financials for this Owner
Home Financials are based on the most recent Mortgage that was taken out on this home.
Original Mortgage
$450,000
Interest Rate
6.98%
Mortgage Type
Seller Take Back
Purchase Details
Closed on
Jul 28, 1999
Sold by
Sabrina Shin
Bought by
Shin Alexander and Shin Sabrina
Purchase Details
Closed on
May 18, 1999
Sold by
Shin Alexander and Shin Sabrina
Bought by
Shin Sabrina and Shin Family Trust
Purchase Details
Closed on
Jul 6, 1998
Sold by
Partridge Don W & Betty J 1986 Trust and Don W
Bought by
Shin Alexander and Shin Sabrina
Create a Home Valuation Report for This Property
The Home Valuation Report is an in-depth analysis detailing your home's value as well as a comparison with similar homes in the area
Home Values in the Area
Average Home Value in this Area
Purchase History
| Date | Buyer | Sale Price | Title Company |
|---|---|---|---|
| Ljm Llc | -- | Han & Park Law Group Inc | |
| Lee Suk Man | $800,000 | First American Title Co | |
| Shin Alexander | -- | -- | |
| Shin Sabrina | -- | -- | |
| Shin Alexander | -- | First American Title Ins Co |
Source: Public Records
Mortgage History
| Date | Status | Borrower | Loan Amount |
|---|---|---|---|
| Previous Owner | Lee Suk Man | $450,000 |
Source: Public Records
Tax History
| Year | Tax Paid | Tax Assessment Tax Assessment Total Assessment is a certain percentage of the fair market value that is determined by local assessors to be the total taxable value of land and additions on the property. | Land | Improvement |
|---|---|---|---|---|
| 2025 | $14,905 | $1,205,457 | $565,058 | $640,399 |
| 2024 | $14,905 | $1,181,821 | $553,978 | $627,843 |
| 2023 | $14,372 | $1,158,649 | $543,116 | $615,533 |
| 2022 | $13,948 | $1,135,931 | $532,467 | $603,464 |
| 2021 | $13,839 | $1,113,658 | $522,026 | $591,632 |
| 2020 | $14,091 | $1,102,240 | $516,674 | $585,566 |
| 2019 | $13,702 | $1,080,629 | $506,544 | $574,085 |
| 2018 | $13,513 | $1,059,441 | $496,612 | $562,829 |
| 2017 | $12,839 | $1,038,669 | $486,875 | $551,794 |
| 2016 | $12,399 | $1,018,304 | $477,329 | $540,975 |
| 2015 | $12,528 | $1,003,010 | $470,160 | $532,850 |
| 2014 | -- | $983,364 | $460,951 | $522,413 |
Source: Public Records
Map
Nearby Homes
- 1239 S C St
- 1127 S C St
- 865 S B St Unit Q1
- 819 S B St Unit 34
- 633 Meta St
- 225 W Iris St
- 1030 Ilena St
- 2024 S J St
- 603 S G St
- 550 S G St
- 807 Kingfisher Way
- 1174 Oyster Place Unit 15
- 1231 Lost Point Ln
- 1309 Nautical Way
- 403 E 2nd St
- 1501 Pisco Ln
- 201 203 S E St
- 2151 E Wooley Rd
- 151 S F St
- 425 W 1st St
Your Personal Tour Guide
Ask me questions while you tour the home.