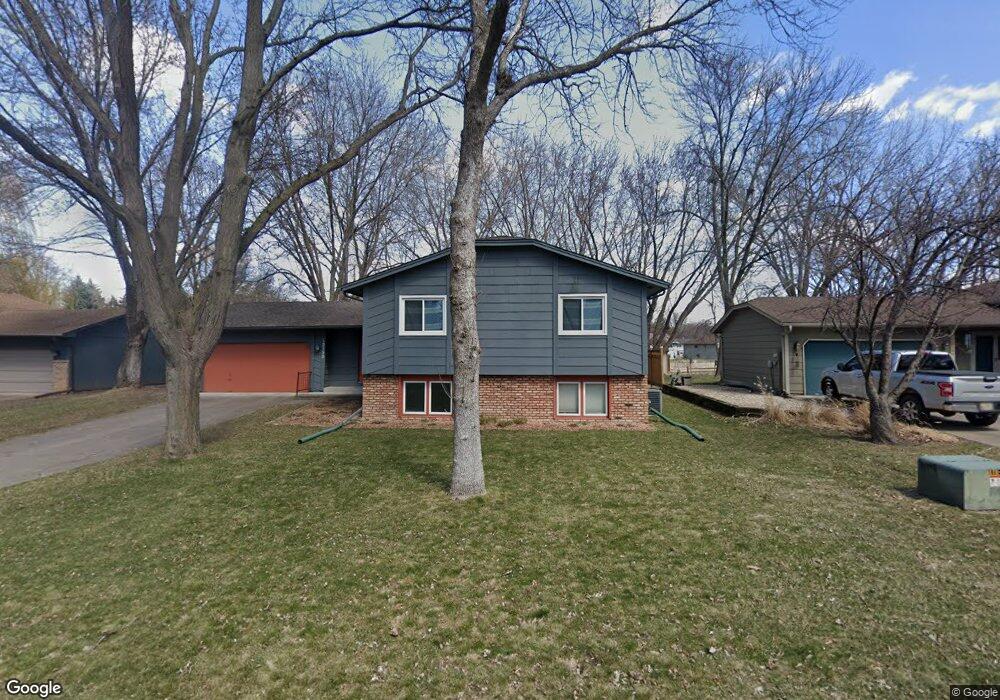
12150 Robin Rd Maple Grove, MN 55369
Estimated Value: $411,000 - $428,148
4
Beds
3
Baths
1,284
Sq Ft
$327/Sq Ft
Est. Value
About This Home
This home is located at 12150 Robin Rd, Maple Grove, MN 55369 and is currently estimated at $419,287, approximately $326 per square foot. 12150 Robin Rd is a home located in Hennepin County with nearby schools including Cedar Island Elementary School, Maple Grove Middle School, and Osseo Senior High School.
Ownership History
Date
Name
Owned For
Owner Type
Purchase Details
Closed on
Jul 27, 2011
Sold by
Wells Fargo Bank Na
Bought by
Brink Jennifer K
Current Estimated Value
Home Financials for this Owner
Home Financials are based on the most recent Mortgage that was taken out on this home.
Original Mortgage
$164,000
Interest Rate
4.23%
Mortgage Type
New Conventional
Purchase Details
Closed on
Dec 10, 2010
Sold by
True Jamie L Field Nka Jamie L
Bought by
Wells Fargo Bank Na
Purchase Details
Closed on
Jan 6, 2006
Sold by
Weeks Michael J and Weeks Heidi A
Bought by
Field Jamie L
Create a Home Valuation Report for This Property
The Home Valuation Report is an in-depth analysis detailing your home's value as well as a comparison with similar homes in the area
Home Values in the Area
Average Home Value in this Area
Purchase History
| Date | Buyer | Sale Price | Title Company |
|---|---|---|---|
| Brink Jennifer K | $205,000 | Servicelink | |
| Wells Fargo Bank Na | $225,717 | -- | |
| Field Jamie L | $264,000 | -- |
Source: Public Records
Mortgage History
| Date | Status | Borrower | Loan Amount |
|---|---|---|---|
| Previous Owner | Brink Jennifer K | $164,000 |
Source: Public Records
Tax History Compared to Growth
Tax History
| Year | Tax Paid | Tax Assessment Tax Assessment Total Assessment is a certain percentage of the fair market value that is determined by local assessors to be the total taxable value of land and additions on the property. | Land | Improvement |
|---|---|---|---|---|
| 2024 | $4,595 | $386,100 | $130,300 | $255,800 |
| 2023 | $4,485 | $384,100 | $121,900 | $262,200 |
| 2022 | $3,619 | $386,500 | $119,000 | $267,500 |
| 2021 | $3,612 | $305,600 | $77,200 | $228,400 |
| 2020 | $3,800 | $299,200 | $77,200 | $222,000 |
| 2019 | $3,700 | $300,600 | $86,300 | $214,300 |
| 2018 | $3,482 | $278,400 | $73,300 | $205,100 |
| 2017 | $3,417 | $245,800 | $67,000 | $178,800 |
| 2016 | $3,455 | $244,900 | $80,000 | $164,900 |
| 2015 | $3,288 | $228,600 | $68,000 | $160,600 |
| 2014 | -- | $216,600 | $70,500 | $146,100 |
Source: Public Records
Map
Nearby Homes
- 12083 Robin Rd
- 6905 Ives Ln N
- 6412 Xenium Ln N
- 6942 Ives Ln N
- 13505 63rd Ave N
- 6245 Annapolis Ln N
- 13940 64th Ave N
- 6215 Deerwood Cir N
- 13445 60th Place N Unit 94
- 5995 Wedgewood Ln N Unit 75
- 7285 Kirkwood Ln N
- 5955 Wedgewood Ln N Unit 71
- 11081 69th Ave N
- 13960 71st Ave N
- 11081 69th Place N
- 12585 74th Ave N
- 5915 Yucca Ln N
- 10947 69th Ave N
- 7000 Yorktown Ln N
- 11053 N Eagle Lake Blvd
- 12148 Robin Rd
- 12142 Robin Rd
- 12145 Robin Rd
- 12149 Robin Rd
- 12141 Robin Rd
- 12153 Robin Rd
- 12138 Robin Rd
- 12137 Robin Rd
- 12157 Robin Rd
- 6520 Pineview Ln N
- 12168 Robin Rd
- 6530 Pineview Ln N
- 6617 Meadowlark Ln N
- 12161 Robin Rd
- 6510 Pineview Ln N
- 6540 Pineview Ln N
- 12134 Robin Rd
- 12133 Robin Rd
- 6613 Meadowlark Ln N
- 12167 Robin Rd