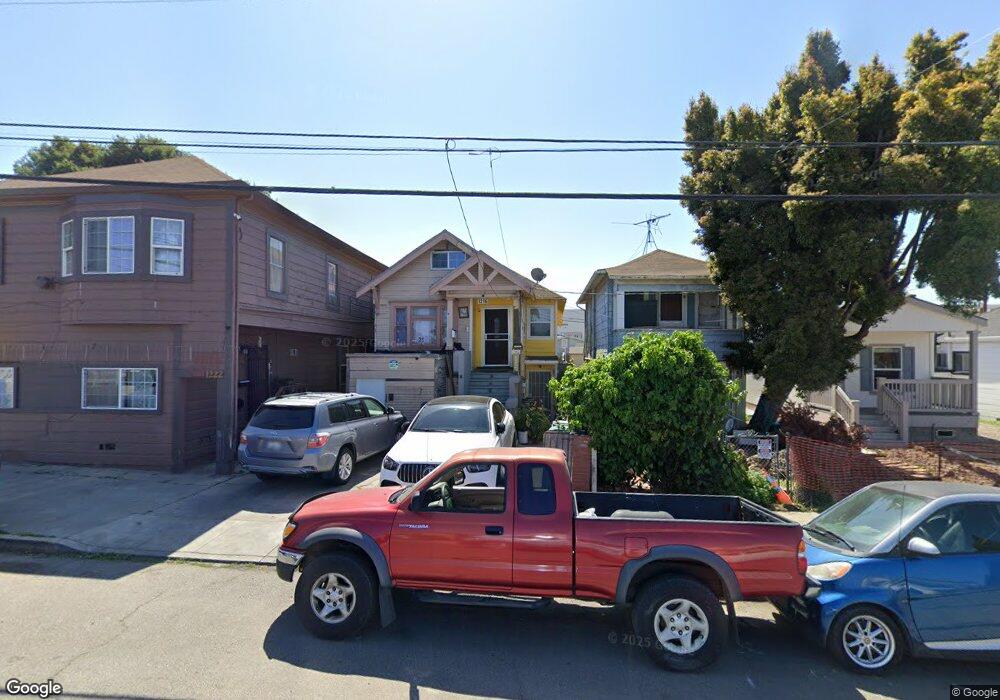
1216 53rd Ave Oakland, CA 94601
Melrose NeighborhoodEstimated Value: $491,000 - $514,000
2
Beds
1
Bath
1,056
Sq Ft
$477/Sq Ft
Est. Value
About This Home
This home is located at 1216 53rd Ave, Oakland, CA 94601 and is currently estimated at $503,838, approximately $477 per square foot. 1216 53rd Ave is a home located in Alameda County with nearby schools including Bridges Academy Elementary School, Greenleaf TK-8, and Coliseum College Prep Academy.
Ownership History
Date
Name
Owned For
Owner Type
Purchase Details
Closed on
Jun 24, 2025
Sold by
Barajas Pablo Zepeda
Bought by
Zepeda Chavarria Family Revocable Living Trus and Barajas
Current Estimated Value
Purchase Details
Closed on
Feb 17, 2005
Sold by
Rodriguez Carmen Chavarria
Bought by
Zepeda Pablo
Home Financials for this Owner
Home Financials are based on the most recent Mortgage that was taken out on this home.
Original Mortgage
$232,800
Interest Rate
5.73%
Mortgage Type
Purchase Money Mortgage
Purchase Details
Closed on
May 3, 2002
Sold by
Steccati Hugo and Estate Of Edith Tofanelli
Bought by
Rodriguez Felipe and Rodriguez Maria
Home Financials for this Owner
Home Financials are based on the most recent Mortgage that was taken out on this home.
Original Mortgage
$168,300
Interest Rate
7.18%
Purchase Details
Closed on
Oct 14, 1996
Sold by
Steccati Alva
Bought by
Tofanelli Edith
Create a Home Valuation Report for This Property
The Home Valuation Report is an in-depth analysis detailing your home's value as well as a comparison with similar homes in the area
Home Values in the Area
Average Home Value in this Area
Purchase History
| Date | Buyer | Sale Price | Title Company |
|---|---|---|---|
| Zepeda Chavarria Family Revocable Living Trus | -- | None Listed On Document | |
| Zepeda Pablo | -- | Fidelity National Title Co | |
| Zepeda Pablo | $240,000 | Fidelity National Title Co | |
| Rodriguez Felipe | $187,000 | First American Title Guarant | |
| Tofanelli Edith | -- | -- |
Source: Public Records
Mortgage History
| Date | Status | Borrower | Loan Amount |
|---|---|---|---|
| Previous Owner | Zepeda Pablo | $232,800 | |
| Previous Owner | Rodriguez Felipe | $168,300 |
Source: Public Records
Tax History Compared to Growth
Tax History
| Year | Tax Paid | Tax Assessment Tax Assessment Total Assessment is a certain percentage of the fair market value that is determined by local assessors to be the total taxable value of land and additions on the property. | Land | Improvement |
|---|---|---|---|---|
| 2025 | $5,893 | $327,507 | $100,352 | $234,155 |
| 2024 | $5,893 | $320,950 | $98,385 | $229,565 |
| 2023 | $6,113 | $321,520 | $96,456 | $225,064 |
| 2022 | $5,912 | $308,217 | $94,565 | $220,652 |
| 2021 | $5,566 | $302,037 | $92,711 | $216,326 |
| 2020 | $5,503 | $305,870 | $91,761 | $214,109 |
| 2019 | $5,242 | $299,874 | $89,962 | $209,912 |
| 2018 | $5,134 | $293,997 | $88,199 | $205,798 |
| 2017 | $4,917 | $288,234 | $86,470 | $201,764 |
| 2016 | $4,703 | $282,584 | $84,775 | $197,809 |
| 2015 | $4,675 | $278,341 | $83,502 | $194,839 |
| 2014 | $4,339 | $250,000 | $75,000 | $175,000 |
Source: Public Records
Map
Nearby Homes
- 1024 50th Ave
- 1436 52nd Ave
- 1433 50th Ave
- 1244 58th Ave
- 1109 Seminary Ave
- 1434 47th Ave
- 1424 57th Ave
- 1163 60th Ave
- 1507 48th Ave
- 5483 Wadean Place
- 1128 60th Ave
- 1301 60th Ave
- 5217 Bancroft Ave
- 1321 60th Ave
- 1605 57th Ave
- 1620 46th Ave
- 5715 E 16th St
- 5540 E 17th St
- 1604 57th Ave
- 5910 International Blvd