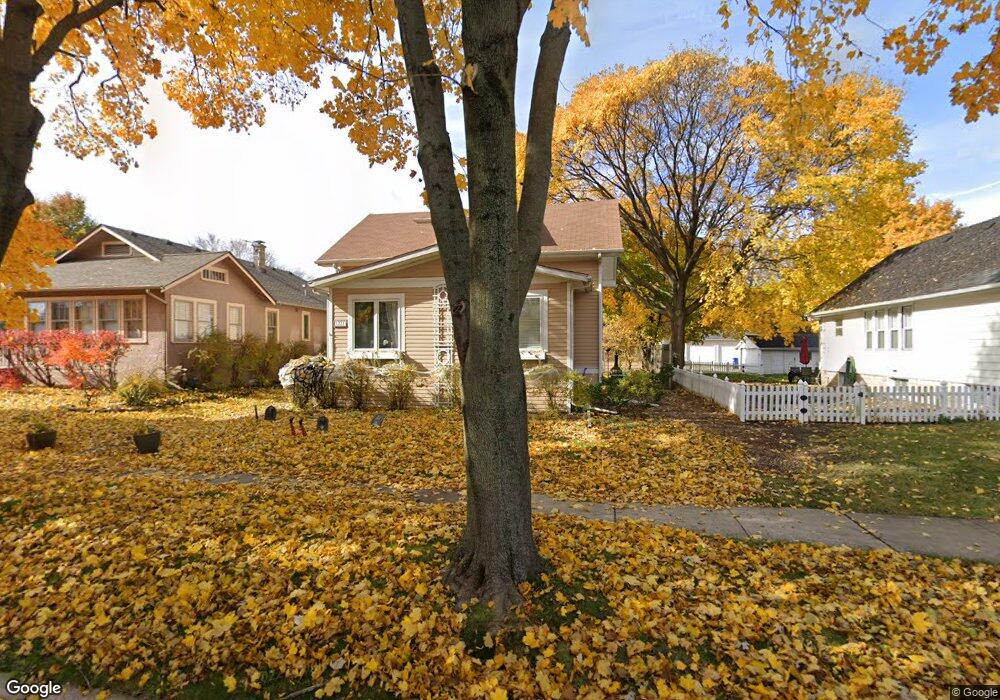
1221 S 2nd St Saint Charles, IL 60174
Southwest Saint Charles NeighborhoodEstimated Value: $359,833 - $404,000
3
Beds
1
Bath
1,262
Sq Ft
$306/Sq Ft
Est. Value
About This Home
This home is located at 1221 S 2nd St, Saint Charles, IL 60174 and is currently estimated at $385,708, approximately $305 per square foot. 1221 S 2nd St is a home located in Kane County with nearby schools including Davis Primary School, Richmond Intermediate School, and Thompson Middle School.
Ownership History
Date
Name
Owned For
Owner Type
Purchase Details
Closed on
Nov 5, 2002
Sold by
Belz Robert
Bought by
Belz Robert and Belz Victoria
Current Estimated Value
Purchase Details
Closed on
May 26, 2000
Sold by
Mcconkey Todd L and Mcconkey Laura K
Bought by
Belz Robert
Home Financials for this Owner
Home Financials are based on the most recent Mortgage that was taken out on this home.
Original Mortgage
$124,750
Outstanding Balance
$45,044
Interest Rate
8.56%
Estimated Equity
$340,664
Purchase Details
Closed on
May 15, 1998
Sold by
Maywald Louise Brunn and Eleanor F Brunn Declaration Of
Bought by
Mcconkey Todd L and Mcconkey Laura K
Home Financials for this Owner
Home Financials are based on the most recent Mortgage that was taken out on this home.
Original Mortgage
$140,650
Interest Rate
7.19%
Mortgage Type
FHA
Create a Home Valuation Report for This Property
The Home Valuation Report is an in-depth analysis detailing your home's value as well as a comparison with similar homes in the area
Home Values in the Area
Average Home Value in this Area
Purchase History
| Date | Buyer | Sale Price | Title Company |
|---|---|---|---|
| Belz Robert | -- | Chicago Title Insurance Co | |
| Belz Robert | $185,000 | Advanced Title Services Inc | |
| Mcconkey Todd L | $134,500 | Advanced Title Services Inc |
Source: Public Records
Mortgage History
| Date | Status | Borrower | Loan Amount |
|---|---|---|---|
| Open | Belz Robert | $124,750 | |
| Previous Owner | Mcconkey Todd L | $140,650 |
Source: Public Records
Tax History Compared to Growth
Tax History
| Year | Tax Paid | Tax Assessment Tax Assessment Total Assessment is a certain percentage of the fair market value that is determined by local assessors to be the total taxable value of land and additions on the property. | Land | Improvement |
|---|---|---|---|---|
| 2024 | $7,192 | $104,882 | $32,398 | $72,484 |
| 2023 | $6,873 | $93,871 | $28,997 | $64,874 |
| 2022 | $6,774 | $89,903 | $28,406 | $61,497 |
| 2021 | $6,500 | $85,696 | $27,077 | $58,619 |
| 2020 | $6,428 | $84,098 | $26,572 | $57,526 |
| 2019 | $6,308 | $82,433 | $26,046 | $56,387 |
| 2018 | $6,008 | $78,439 | $23,429 | $55,010 |
| 2017 | $5,845 | $75,757 | $22,628 | $53,129 |
| 2016 | $6,130 | $73,096 | $21,833 | $51,263 |
| 2015 | -- | $68,970 | $21,598 | $47,372 |
| 2014 | -- | $65,342 | $21,598 | $43,744 |
| 2013 | -- | $66,190 | $21,814 | $44,376 |
Source: Public Records
Map
Nearby Homes
- 1205 S 4th St
- 82 Gray St
- 800 Anderson Blvd
- 420 Gray St
- 1008 Pine St
- 910 S 4th St
- 617 Horne St
- 57 White Oak Cir
- 1015 S 6th St
- 885 Geneva Rd
- Lot 1 Keller Place
- 802 Union St
- Lot 1 Geneva Rd
- Lot 2 Geneva Rd
- 629 N Lincoln Ave
- 609 Mckinley Ave
- 625 S 5th St
- 511 S 7th St
- 450 S 1st St Unit 404
- 402 Brownstone Dr
- 1215 S 2nd St
- 1225 S 2nd St
- 1211 S 2nd St
- 1229 S 2nd St
- 1218 S 3rd St
- 208 Fellows St
- 1222 S 3rd St
- 1214 S 3rd St
- 1228 S 3rd St
- 1210 S 3rd St
- 1218 S 2nd St
- 1212 S 2nd St
- 1212 S 2nd St Unit LOWER
- 1212 S 2nd St Unit UPPER
- 1214 S 2nd St
- 1222 S 2nd St
- 203 Mckinley St
- 1204 S 3rd St
- 1232 S 3rd St
- 1226 S 2nd St