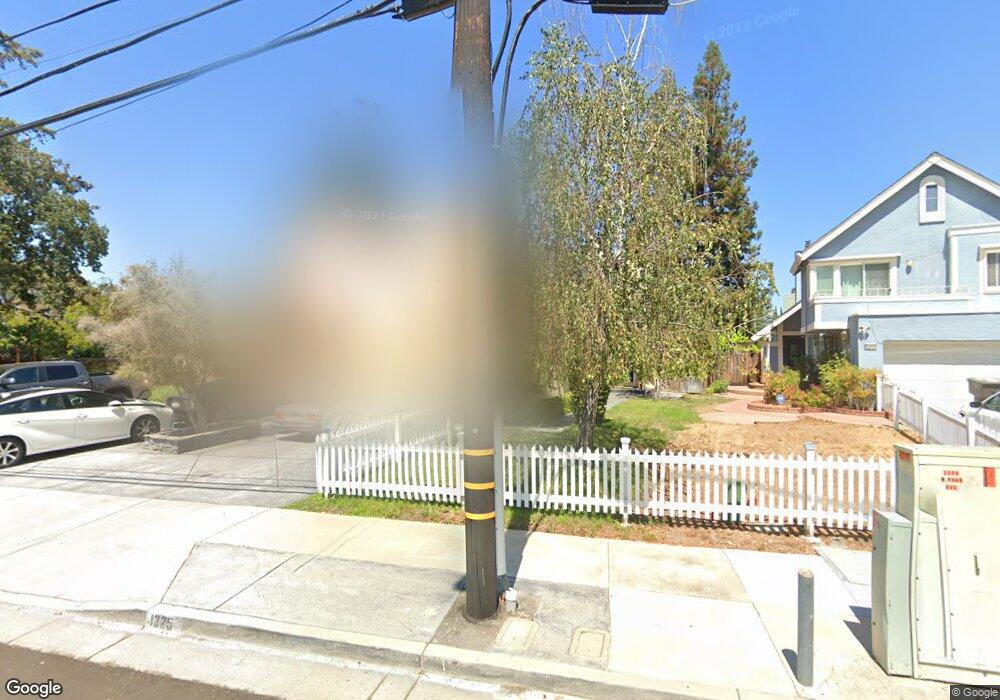
1225 W Parr Ave Campbell, CA 95008
San Tomas NeighborhoodEstimated Value: $1,569,000 - $1,988,000
2
Beds
3
Baths
1,693
Sq Ft
$1,016/Sq Ft
Est. Value
About This Home
This home is located at 1225 W Parr Ave, Campbell, CA 95008 and is currently estimated at $1,720,762, approximately $1,016 per square foot. 1225 W Parr Ave is a home located in Santa Clara County with nearby schools including Westmont High School, Village School, and Capri Elementary.
Ownership History
Date
Name
Owned For
Owner Type
Purchase Details
Closed on
Aug 27, 2008
Sold by
Heliotis Dionysis and Heliotis Maureen
Bought by
Heliotis Dionysis N and Heliotis Maureen E
Current Estimated Value
Purchase Details
Closed on
Jun 17, 2005
Sold by
Heliotis Dionysis
Bought by
Heliotis Dionysis and Heliotis Maureen
Purchase Details
Closed on
Sep 27, 2000
Sold by
Heliotis Maureen Elena
Bought by
Heliotis Dionysis
Home Financials for this Owner
Home Financials are based on the most recent Mortgage that was taken out on this home.
Original Mortgage
$426,250
Outstanding Balance
$156,448
Interest Rate
8.01%
Mortgage Type
Stand Alone First
Estimated Equity
$1,564,314
Purchase Details
Closed on
Dec 1, 1999
Sold by
Trustee Petroutsas Anthony And Catherine
Bought by
Heliotis Dionysis
Home Financials for this Owner
Home Financials are based on the most recent Mortgage that was taken out on this home.
Original Mortgage
$243,000
Interest Rate
7.96%
Purchase Details
Closed on
Nov 23, 1999
Sold by
Heliotis Maureen
Bought by
Heliotis Dionysis
Home Financials for this Owner
Home Financials are based on the most recent Mortgage that was taken out on this home.
Original Mortgage
$243,000
Interest Rate
7.96%
Create a Home Valuation Report for This Property
The Home Valuation Report is an in-depth analysis detailing your home's value as well as a comparison with similar homes in the area
Home Values in the Area
Average Home Value in this Area
Purchase History
| Date | Buyer | Sale Price | Title Company |
|---|---|---|---|
| Heliotis Dionysis N | -- | None Available | |
| Heliotis Dionysis | -- | -- | |
| Heliotis Dionysis | -- | Fidelity National Title Ins | |
| Heliotis Dionysis | $315,000 | Chicago Title Co | |
| Heliotis Dionysis | -- | Chicago Title Co |
Source: Public Records
Mortgage History
| Date | Status | Borrower | Loan Amount |
|---|---|---|---|
| Open | Heliotis Dionysis | $426,250 | |
| Closed | Heliotis Dionysis | $243,000 |
Source: Public Records
Tax History Compared to Growth
Tax History
| Year | Tax Paid | Tax Assessment Tax Assessment Total Assessment is a certain percentage of the fair market value that is determined by local assessors to be the total taxable value of land and additions on the property. | Land | Improvement |
|---|---|---|---|---|
| 2025 | $6,713 | $490,821 | $307,388 | $183,433 |
| 2024 | $6,713 | $481,198 | $301,361 | $179,837 |
| 2023 | $6,625 | $471,763 | $295,452 | $176,311 |
| 2022 | $6,616 | $462,513 | $289,659 | $172,854 |
| 2021 | $6,483 | $453,445 | $283,980 | $169,465 |
| 2020 | $6,307 | $448,797 | $281,069 | $167,728 |
| 2019 | $6,207 | $439,998 | $275,558 | $164,440 |
| 2018 | $6,010 | $431,371 | $270,155 | $161,216 |
| 2017 | $5,912 | $422,913 | $264,858 | $158,055 |
| 2016 | $5,555 | $414,621 | $259,665 | $154,956 |
| 2015 | $5,445 | $408,394 | $255,765 | $152,629 |
| 2014 | $5,206 | $400,395 | $250,755 | $149,640 |
Source: Public Records
Map
Nearby Homes
- 101 Peach Willow Ct
- 1170 Steinway Ave
- 14225 Lora Dr Unit 90
- 14225 Lora Dr Unit 36
- 14225 Lora Dr Unit 70
- 107 Naramore Ln
- 14375 La Rinconada Dr
- 1097-1099 W Hacienda Ave
- 207 Palmer Dr
- 14145 Capri Dr
- 915 Bucknam Ave
- 615 Chapman Dr
- 1162 Capri Dr
- 232 More Ave
- 668 W Sunnyoaks Ave
- 112 Mozart Ave
- 142 Calle Larga
- 440 W Hacienda Ave
- 614 Beta Ct
- 14685 Oka Rd Unit 11
- 1227 W Parr Ave
- 1217 W Parr Ave
- 1215 W Parr Ave
- 1229 Pollard Rd
- 1206 Bracebridge Ct
- 1201 W Parr Ave
- 1204 Bracebridge Ct
- 1202 Bracebridge Ct
- 1203 W Parr Ave
- 1205 W Parr Ave
- 1231 Pollard Rd
- 1208 Bracebridge Ct
- 1207 W Parr Ave Unit 4
- 860 W Parr Ave
- 1209 W Parr Ave
- 1211 W Parr Ave
- 1179 Bracebridge Ct
- 850 W Parr Ave
- 1224 Bracebridge Ct
- 1181 Bracebridge Ct