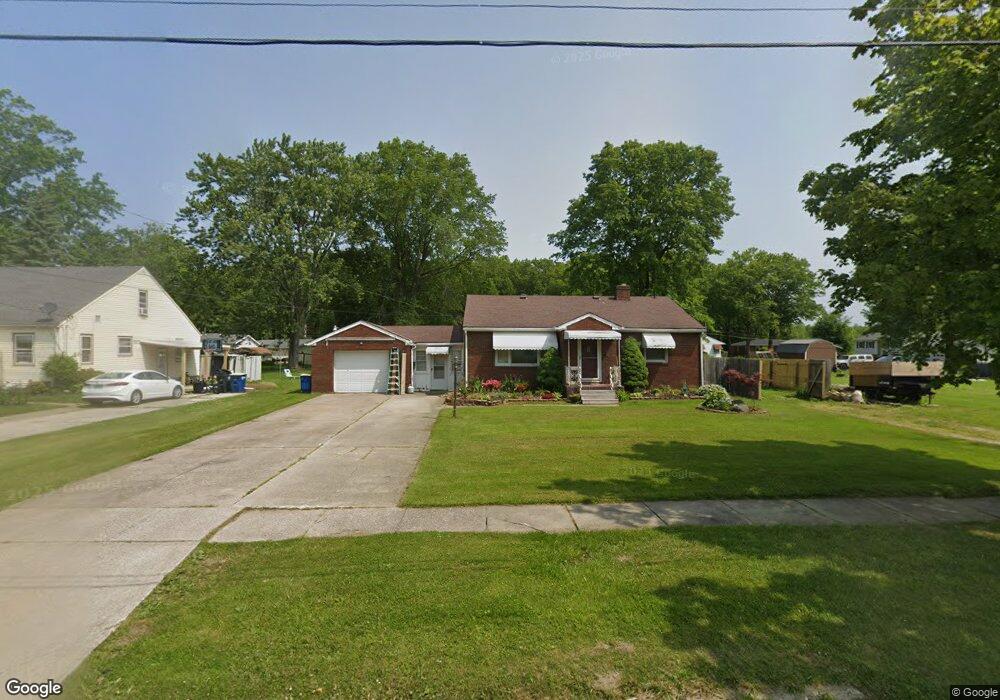
1229 E 16th St Ashtabula, OH 44004
Estimated Value: $119,000 - $160,000
3
Beds
1
Bath
1,080
Sq Ft
$129/Sq Ft
Est. Value
About This Home
This home is located at 1229 E 16th St, Ashtabula, OH 44004 and is currently estimated at $138,943, approximately $128 per square foot. 1229 E 16th St is a home located in Ashtabula County with nearby schools including Lakeside High School and Christian Faith Academy.
Ownership History
Date
Name
Owned For
Owner Type
Purchase Details
Closed on
Dec 28, 2018
Sold by
M F Ashtabula Ltd
Bought by
Martone Francis J
Current Estimated Value
Purchase Details
Closed on
Oct 6, 2004
Sold by
M F Ashtabula Ltd
Bought by
Martone Francis J
Purchase Details
Closed on
Mar 18, 2004
Sold by
M F Ashtabula Ltd
Bought by
Martone Francis J
Purchase Details
Closed on
Sep 8, 2003
Sold by
Bank One Na
Bought by
M F Ashtabula Ltd
Purchase Details
Closed on
Jul 28, 2003
Sold by
Miller Charles A
Bought by
Bank One Na
Purchase Details
Closed on
Oct 10, 1996
Sold by
Mary P Vetrano Est
Bought by
Miller Charles A and Shinault Deanne
Home Financials for this Owner
Home Financials are based on the most recent Mortgage that was taken out on this home.
Original Mortgage
$56,500
Interest Rate
8.14%
Mortgage Type
New Conventional
Create a Home Valuation Report for This Property
The Home Valuation Report is an in-depth analysis detailing your home's value as well as a comparison with similar homes in the area
Home Values in the Area
Average Home Value in this Area
Purchase History
| Date | Buyer | Sale Price | Title Company |
|---|---|---|---|
| Martone Francis J | -- | None Available | |
| Martone Francis J | -- | -- | |
| Martone Francis J | -- | -- | |
| M F Ashtabula Ltd | $56,000 | Multiple | |
| Bank One Na | $81,883 | Multiple | |
| Miller Charles A | $65,000 | -- |
Source: Public Records
Mortgage History
| Date | Status | Borrower | Loan Amount |
|---|---|---|---|
| Previous Owner | Miller Charles A | $56,500 |
Source: Public Records
Tax History
| Year | Tax Paid | Tax Assessment Tax Assessment Total Assessment is a certain percentage of the fair market value that is determined by local assessors to be the total taxable value of land and additions on the property. | Land | Improvement |
|---|---|---|---|---|
| 2024 | $2,503 | $29,130 | $5,010 | $24,120 |
| 2023 | $1,450 | $29,130 | $5,010 | $24,120 |
| 2022 | $1,309 | $23,140 | $3,850 | $19,290 |
| 2021 | $1,320 | $23,140 | $3,850 | $19,290 |
| 2020 | $1,340 | $23,140 | $3,850 | $19,290 |
| 2019 | $1,295 | $21,220 | $4,240 | $16,980 |
| 2018 | $1,200 | $21,220 | $4,240 | $16,980 |
| 2017 | $1,153 | $21,220 | $4,240 | $16,980 |
| 2016 | $1,139 | $19,290 | $3,850 | $15,440 |
| 2015 | $1,108 | $19,290 | $3,850 | $15,440 |
| 2014 | $2,398 | $19,290 | $3,850 | $15,440 |
| 2013 | $1,248 | $24,050 | $3,990 | $20,060 |
Source: Public Records
Map
Nearby Homes
- 919 E 17th St
- 0 Scott Ave Unit 5167555
- 814 Richards Ave
- 0 E 23rd St Unit 5187222
- 1331 E 28th St
- 136 Minnesota Ave
- 0 Middle Rd
- 3033 Avon Blvd
- 3001 Blair Ave
- 3003 Blair Ave
- 3024 Latimer Ave
- 3129 Lincoln Dr
- V/L W 12
- 1712 W 6th St
- 306 Pennsylvania Ave
- 1728 W 10th St
- 1820 W 10th St
- 1010 Ohio Ave
- 1028 Ohio Ave
- 505 W 36th St
- 1241 E 16th St
- 1219 E 16th St
- 1232 E 15th St
- 1211 E 16th St
- 1240 E 15th St
- 1220 E 15th St
- 1234 E 16th St
- 1226 E 16th St
- 1240 E 16th St
- 1220 E 16th St
- 1311 E 16th St
- 1506 Garfield Ave
- 1312 E 16th St
- 1203 E 16th St
- 1214 E 16th St
- 1206 E 15th St
- 1206 E 16th St
- 1233 E 15th St
- 1307 E 15th St
- 1145 E 16th St
Your Personal Tour Guide
Ask me questions while you tour the home.