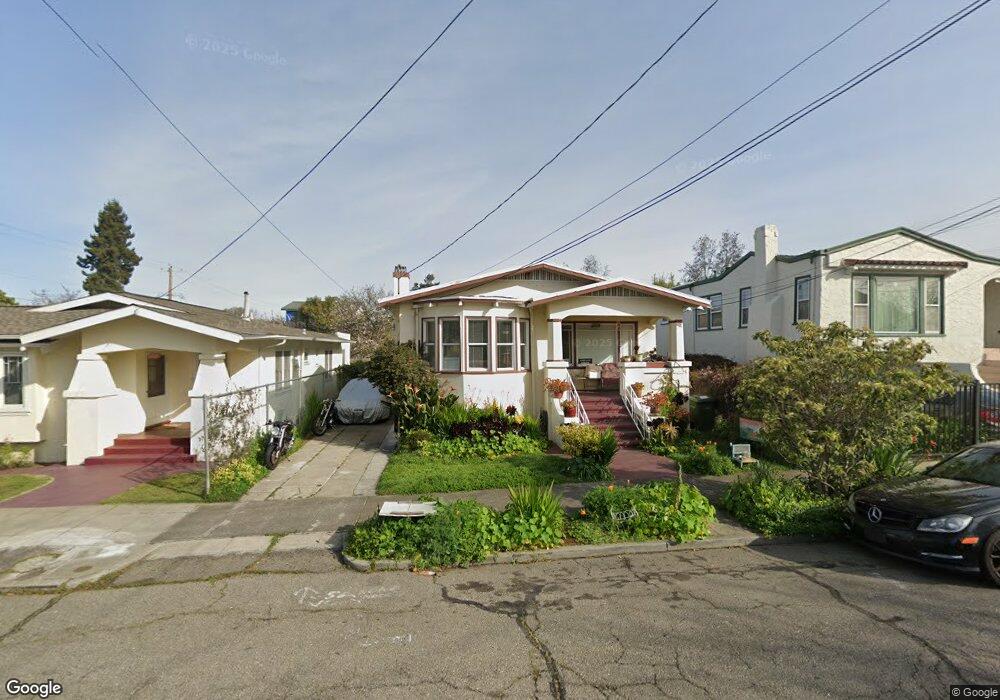
1231 Allston Way Berkeley, CA 94702
West Berkeley NeighborhoodEstimated Value: $986,000 - $1,177,582
2
Beds
1
Bath
1,500
Sq Ft
$717/Sq Ft
Est. Value
About This Home
This home is located at 1231 Allston Way, Berkeley, CA 94702 and is currently estimated at $1,076,146, approximately $717 per square foot. 1231 Allston Way is a home located in Alameda County with nearby schools including Rosa Parks Elementary School, Ruth Acty Elementary, and Berkeley Arts Magnet at Whittier School.
Ownership History
Date
Name
Owned For
Owner Type
Purchase Details
Closed on
Jun 18, 2008
Sold by
Pimentel Jeanne
Bought by
Revoc Pimentel Jeanne Robinson and Revoc Jeanne Robinson Pimentel
Current Estimated Value
Purchase Details
Closed on
Apr 22, 1999
Sold by
Kretz Linda L and Blacksher Eva
Bought by
Pimentel Jeanne
Home Financials for this Owner
Home Financials are based on the most recent Mortgage that was taken out on this home.
Original Mortgage
$171,450
Interest Rate
6.98%
Purchase Details
Closed on
Nov 12, 1998
Sold by
Cole Ruth L
Bought by
Blacksher Eva
Purchase Details
Closed on
Jul 7, 1997
Sold by
Blacksher Eva
Bought by
Cole Ruth L and Blacksher Eva
Purchase Details
Closed on
Jun 15, 1994
Sold by
Max R Schroer Enterprises Inc
Bought by
Lindstrom Don
Create a Home Valuation Report for This Property
The Home Valuation Report is an in-depth analysis detailing your home's value as well as a comparison with similar homes in the area
Home Values in the Area
Average Home Value in this Area
Purchase History
| Date | Buyer | Sale Price | Title Company |
|---|---|---|---|
| Revoc Pimentel Jeanne Robinson | -- | None Available | |
| Pimentel Jeanne | $190,500 | Placer Title Company | |
| Blacksher Eva | -- | -- | |
| Cole Ruth L | -- | -- | |
| Lindstrom Don | $122,000 | -- |
Source: Public Records
Mortgage History
| Date | Status | Borrower | Loan Amount |
|---|---|---|---|
| Previous Owner | Pimentel Jeanne | $171,450 |
Source: Public Records
Tax History
| Year | Tax Paid | Tax Assessment Tax Assessment Total Assessment is a certain percentage of the fair market value that is determined by local assessors to be the total taxable value of land and additions on the property. | Land | Improvement |
|---|---|---|---|---|
| 2025 | $7,506 | $298,630 | $89,667 | $208,963 |
| 2024 | $7,506 | $292,777 | $87,910 | $204,867 |
| 2023 | $7,236 | $287,037 | $86,186 | $200,851 |
| 2022 | $7,034 | $274,409 | $84,496 | $196,913 |
| 2021 | $7,002 | $268,893 | $82,840 | $193,053 |
| 2020 | $6,450 | $273,064 | $81,991 | $191,073 |
| 2019 | $6,003 | $267,710 | $80,383 | $187,327 |
| 2018 | $5,860 | $262,462 | $78,807 | $183,655 |
| 2017 | $5,626 | $257,316 | $77,262 | $180,054 |
| 2016 | $5,315 | $252,273 | $75,748 | $176,525 |
| 2015 | $5,225 | $248,483 | $74,610 | $173,873 |
| 2014 | $7,009 | $243,617 | $73,149 | $170,468 |
Source: Public Records
Map
Nearby Homes
- 2231 Byron St
- 2324 Browning St
- 1919 Curtis St
- 1039 Channing Way
- 2304 Edwards St
- 2341 9th St
- 2423 10th St
- 1142 Dwight Way
- 1128 Delaware St
- 1118 Dwight Way
- 2350 Sacramento St
- 2437 Acton St
- 1050 Allston Way
- 917 Channing Way
- 2220 7th St
- 1411 Hearst Ave Unit 2
- 2238 7th St
- 1728 Curtis St
- 1135 Parker St
- 1207 Francisco St
- 1237 Allston Way
- 1229 Allston Way
- 1239 Allston Way
- 1225 Allston Way
- 2141 Browning St
- 2138 Bonar St
- 2137 Browning St
- 1243 Allston Way
- 2146 Bonar St
- 1245 Allston Way
- 2134 Bonar St
- 2133 Browning St
- 2130 Bonar St
- 1234 Allston Way
- 1236 Allston Way
- 1230 Allston Way
- 1244 Allston Way
- 1219 Allston Way
- 2203 Browning St
- 2129 Browning St
Your Personal Tour Guide
Ask me questions while you tour the home.