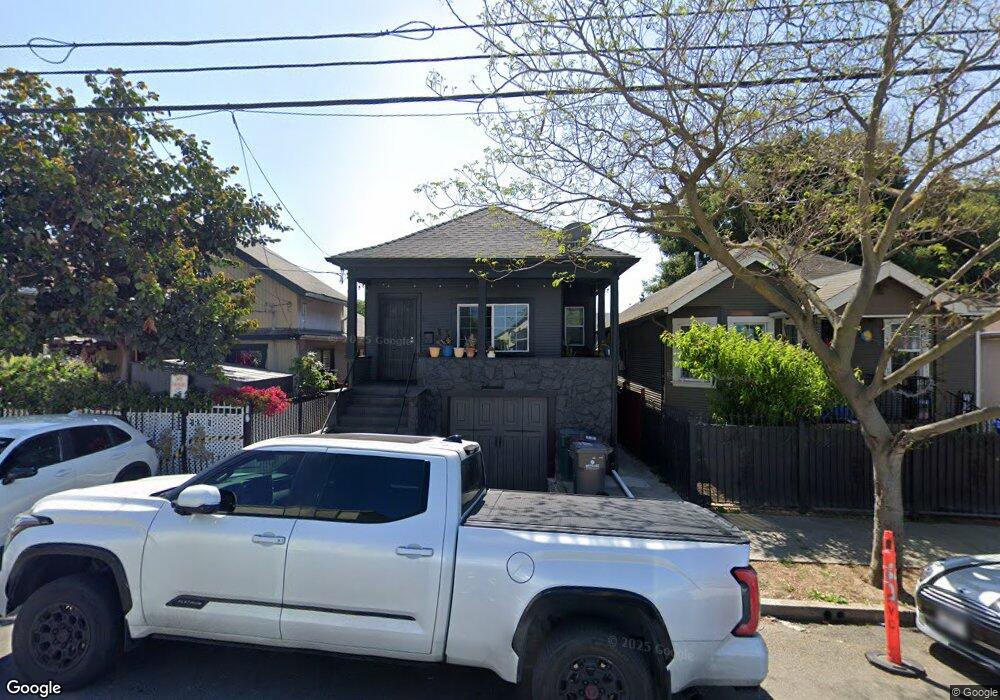
1234 53rd Ave Oakland, CA 94601
Melrose NeighborhoodEstimated Value: $419,000 - $591,000
3
Beds
2
Baths
920
Sq Ft
$560/Sq Ft
Est. Value
About This Home
This home is located at 1234 53rd Ave, Oakland, CA 94601 and is currently estimated at $515,214, approximately $560 per square foot. 1234 53rd Ave is a home located in Alameda County with nearby schools including Bridges Academy Elementary School, Greenleaf TK-8, and Coliseum College Prep Academy.
Ownership History
Date
Name
Owned For
Owner Type
Purchase Details
Closed on
Jun 15, 2016
Sold by
Obad Ali
Bought by
Winchell Walter A
Current Estimated Value
Home Financials for this Owner
Home Financials are based on the most recent Mortgage that was taken out on this home.
Original Mortgage
$401,000
Outstanding Balance
$319,567
Interest Rate
3.61%
Mortgage Type
VA
Estimated Equity
$195,647
Purchase Details
Closed on
Jun 25, 2015
Sold by
Griffin Sharon and Thompson Rachel
Bought by
Obad Ali
Create a Home Valuation Report for This Property
The Home Valuation Report is an in-depth analysis detailing your home's value as well as a comparison with similar homes in the area
Home Values in the Area
Average Home Value in this Area
Purchase History
| Date | Buyer | Sale Price | Title Company |
|---|---|---|---|
| Winchell Walter A | $401,000 | Old Republic Title Company | |
| Obad Ali | $192,500 | First American Title Company |
Source: Public Records
Mortgage History
| Date | Status | Borrower | Loan Amount |
|---|---|---|---|
| Open | Winchell Walter A | $401,000 |
Source: Public Records
Tax History Compared to Growth
Tax History
| Year | Tax Paid | Tax Assessment Tax Assessment Total Assessment is a certain percentage of the fair market value that is determined by local assessors to be the total taxable value of land and additions on the property. | Land | Improvement |
|---|---|---|---|---|
| 2025 | $7,714 | $474,691 | $142,407 | $332,284 |
| 2024 | $7,714 | $465,384 | $139,615 | $325,769 |
| 2023 | $8,058 | $456,261 | $136,878 | $319,383 |
| 2022 | $7,827 | $447,314 | $134,194 | $313,120 |
| 2021 | $7,442 | $438,544 | $131,563 | $306,981 |
| 2020 | $7,360 | $434,050 | $130,215 | $303,835 |
| 2019 | $7,058 | $425,540 | $127,662 | $297,878 |
| 2018 | $6,913 | $417,200 | $125,160 | $292,040 |
| 2017 | $6,641 | $409,020 | $122,706 | $286,314 |
| 2016 | $3,580 | $192,500 | $57,700 | $134,800 |
| 2015 | $1,200 | $16,862 | $6,078 | $10,784 |
| 2014 | $1,083 | $16,532 | $5,959 | $10,573 |
Source: Public Records
Map
Nearby Homes