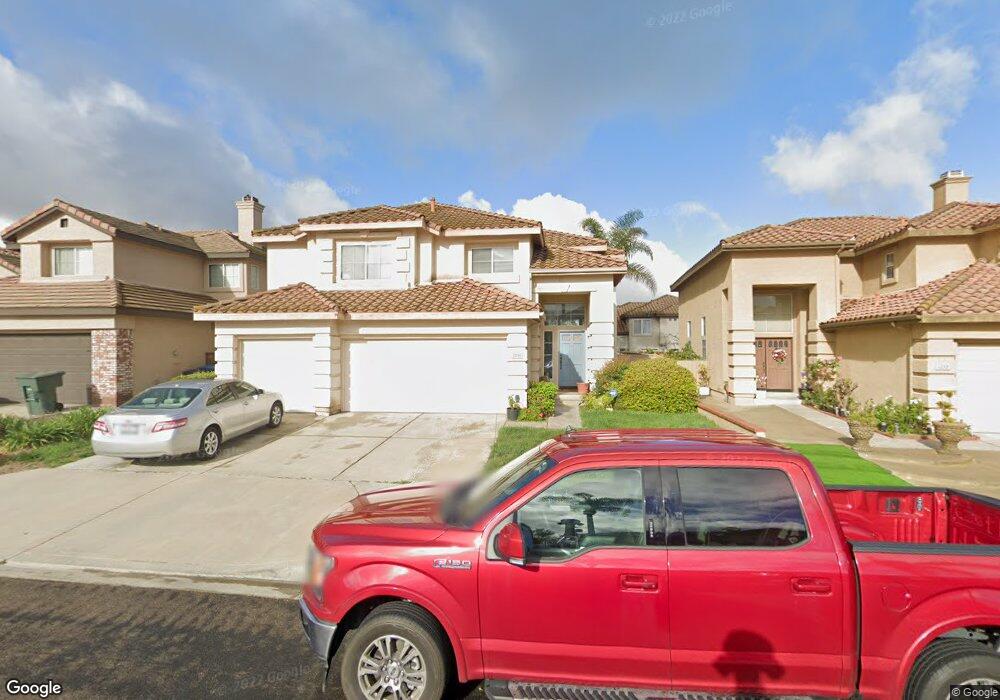
1236 Bodega Bay Dr Chula Vista, CA 91915
Eastlake NeighborhoodEstimated Value: $997,153 - $1,147,000
4
Beds
3
Baths
2,302
Sq Ft
$474/Sq Ft
Est. Value
About This Home
This home is located at 1236 Bodega Bay Dr, Chula Vista, CA 91915 and is currently estimated at $1,091,288, approximately $474 per square foot. 1236 Bodega Bay Dr is a home located in San Diego County with nearby schools including Olympic View Elementary School, Eastlake Middle School, and Eastlake High School.
Ownership History
Date
Name
Owned For
Owner Type
Purchase Details
Closed on
Jun 24, 2008
Sold by
Houseman Fenina Q
Bought by
Houseman Fenina Q
Current Estimated Value
Purchase Details
Closed on
Jun 30, 1999
Sold by
Gain Jeffrey R
Bought by
Houseman Michael J and Houseman Fenina Q
Home Financials for this Owner
Home Financials are based on the most recent Mortgage that was taken out on this home.
Original Mortgage
$206,300
Outstanding Balance
$58,152
Interest Rate
7.64%
Estimated Equity
$1,033,136
Purchase Details
Closed on
Aug 11, 1994
Sold by
Fieldstone Fairway Ridge Lp
Bought by
Gain Jeffrey R and Gain Dawn
Home Financials for this Owner
Home Financials are based on the most recent Mortgage that was taken out on this home.
Original Mortgage
$177,250
Interest Rate
8.65%
Create a Home Valuation Report for This Property
The Home Valuation Report is an in-depth analysis detailing your home's value as well as a comparison with similar homes in the area
Home Values in the Area
Average Home Value in this Area
Purchase History
| Date | Buyer | Sale Price | Title Company |
|---|---|---|---|
| Houseman Fenina Q | -- | None Available | |
| Houseman Michael J | $258,000 | Chicago Title Co | |
| Gain Jeffrey R | $222,000 | First American Title |
Source: Public Records
Mortgage History
| Date | Status | Borrower | Loan Amount |
|---|---|---|---|
| Open | Houseman Michael J | $206,300 | |
| Previous Owner | Gain Jeffrey R | $177,250 |
Source: Public Records
Tax History Compared to Growth
Tax History
| Year | Tax Paid | Tax Assessment Tax Assessment Total Assessment is a certain percentage of the fair market value that is determined by local assessors to be the total taxable value of land and additions on the property. | Land | Improvement |
|---|---|---|---|---|
| 2025 | $4,470 | $396,358 | $82,303 | $314,055 |
| 2024 | $4,470 | $388,588 | $80,690 | $307,898 |
| 2023 | $4,395 | $380,969 | $79,108 | $301,861 |
| 2022 | $4,271 | $373,500 | $77,557 | $295,943 |
| 2021 | $4,169 | $366,178 | $76,037 | $290,141 |
| 2020 | $4,073 | $362,424 | $75,258 | $287,166 |
| 2019 | $3,964 | $355,319 | $73,783 | $281,536 |
| 2018 | $5,280 | $348,353 | $72,337 | $276,016 |
| 2017 | $12 | $341,523 | $70,919 | $270,604 |
| 2016 | $5,035 | $334,828 | $69,529 | $265,299 |
| 2015 | $4,954 | $329,799 | $68,485 | $261,314 |
| 2014 | $5,455 | $323,340 | $67,144 | $256,196 |
Source: Public Records
Map
Nearby Homes
- 1220 Silverado Dr
- 1246 Boca Raton Dr
- 1215 Pinehurst Rd
- 2300 Palomira Ct
- 2408 Green River Dr
- 2181 Caminito Norina Unit 134
- 2088 Bravo Loop
- 2065 Bravo Loop Unit 6
- 1338 Caminito Fabrizio Unit 72
- 1445 Caminito Sicilia
- 0 Towncenter Lot#4
- 1446 Caminito Sardinia
- 1020 Baywood Cir Unit E
- 1526 Caminito Sicilia
- 2505 Whispering Palms Loop
- 1277 Granite Springs Dr
- 1452 S Creekside Dr
- 2235 Old Barn Ln
- 0 Towncenter Lot#3
- 0 Towncenter Lot#30
- 1240 Bodega Bay Dr Unit 8
- 1232 Bodega Bay Dr
- 1233 Half Moon Bay Dr
- 1244 Bodega Bay Dr
- 1228 Bodega Bay Dr
- 1229 Half Moon Bay Dr
- 1237 Half Moon Bay Dr
- 1225 Half Moon Bay Dr
- 1241 Half Moon Bay Dr
- 1224 Bodega Bay Dr
- 1248 Bodega Bay Dr
- 1237 Bodega Bay Dr
- 1233 Bodega Bay Dr
- 1241 Bodega Bay Dr
- 1221 Half Moon Bay Dr
- 1229 Bodega Bay Dr
- 0 Bella Vista Ave Unit NB18087125
- 0 Bella Vista Ave Unit ML81700968
- 0 Bella Vista Unit ML81227008
- 0 Bella Vista Ave Unit 21809150