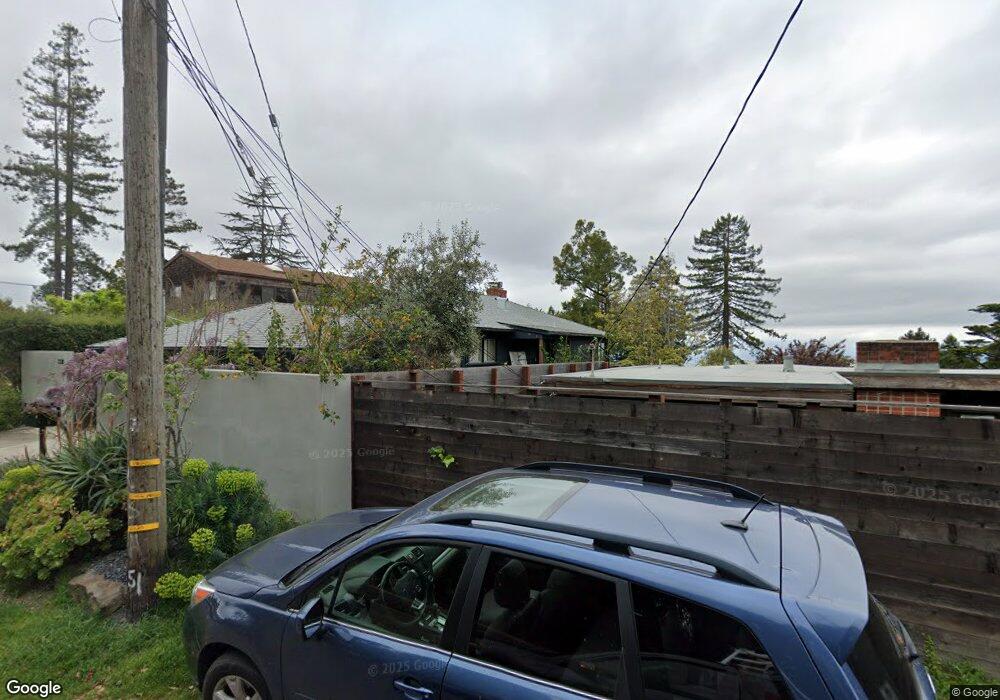
1238 Campus Dr Berkeley, CA 94708
Berkeley Hills NeighborhoodEstimated Value: $1,522,000 - $1,689,000
4
Beds
2
Baths
1,898
Sq Ft
$847/Sq Ft
Est. Value
About This Home
This home is located at 1238 Campus Dr, Berkeley, CA 94708 and is currently estimated at $1,608,212, approximately $847 per square foot. 1238 Campus Dr is a home located in Alameda County with nearby schools including Cragmont Elementary School, Berkeley Arts Magnet at Whittier School, and Washington Elementary School.
Ownership History
Date
Name
Owned For
Owner Type
Purchase Details
Closed on
Dec 7, 2018
Sold by
Chajet Jonathan and Bergstrom Mary Elizabeth
Bought by
Roberts Michael E and Weerasinghe Shanka P
Current Estimated Value
Home Financials for this Owner
Home Financials are based on the most recent Mortgage that was taken out on this home.
Original Mortgage
$945,000
Outstanding Balance
$832,565
Interest Rate
4.8%
Mortgage Type
New Conventional
Estimated Equity
$775,647
Purchase Details
Closed on
Mar 13, 2017
Sold by
Fricke Beate and Wimmer Mario
Bought by
Chajet Jonathan and Bergstrom Mary Elizabeth
Home Financials for this Owner
Home Financials are based on the most recent Mortgage that was taken out on this home.
Original Mortgage
$960,000
Interest Rate
4.17%
Mortgage Type
New Conventional
Purchase Details
Closed on
Jul 23, 2013
Sold by
Abrams Kathryn and Kell William A
Bought by
Fricke Beate and Wimmer Mario
Home Financials for this Owner
Home Financials are based on the most recent Mortgage that was taken out on this home.
Original Mortgage
$650,000
Interest Rate
3.92%
Mortgage Type
New Conventional
Purchase Details
Closed on
Mar 11, 2003
Sold by
Hameed Umar and Gwin Eileen
Bought by
Kell William A and Abrams Kathryn
Home Financials for this Owner
Home Financials are based on the most recent Mortgage that was taken out on this home.
Original Mortgage
$675,900
Interest Rate
5.82%
Purchase Details
Closed on
Dec 17, 1999
Sold by
Harrison Joel and Lombardi Bonnie
Bought by
Hameed Umar and Gwin Eileen
Home Financials for this Owner
Home Financials are based on the most recent Mortgage that was taken out on this home.
Original Mortgage
$355,000
Interest Rate
3.45%
Create a Home Valuation Report for This Property
The Home Valuation Report is an in-depth analysis detailing your home's value as well as a comparison with similar homes in the area
Home Values in the Area
Average Home Value in this Area
Purchase History
| Date | Buyer | Sale Price | Title Company |
|---|---|---|---|
| Roberts Michael E | $1,350,000 | Old Republic Title Company M | |
| Chajet Jonathan | $1,200,000 | Chicago Title Company | |
| Fricke Beate | $740,000 | Placer Title Company | |
| Kell William A | $751,000 | Placer Title Company | |
| Hameed Umar | $475,000 | New Century Title Company |
Source: Public Records
Mortgage History
| Date | Status | Borrower | Loan Amount |
|---|---|---|---|
| Open | Roberts Michael E | $945,000 | |
| Previous Owner | Chajet Jonathan | $960,000 | |
| Previous Owner | Fricke Beate | $650,000 | |
| Previous Owner | Kell William A | $675,900 | |
| Previous Owner | Hameed Umar | $355,000 | |
| Closed | Kell William A | $37,550 |
Source: Public Records
Tax History
| Year | Tax Paid | Tax Assessment Tax Assessment Total Assessment is a certain percentage of the fair market value that is determined by local assessors to be the total taxable value of land and additions on the property. | Land | Improvement |
|---|---|---|---|---|
| 2025 | $21,173 | $1,505,925 | $557,750 | $948,175 |
| 2024 | $21,173 | $1,476,400 | $546,815 | $929,585 |
| 2023 | $20,754 | $1,447,456 | $536,095 | $911,361 |
| 2022 | $20,428 | $1,419,079 | $525,585 | $893,494 |
| 2021 | $20,509 | $1,391,256 | $515,280 | $875,976 |
| 2020 | $19,521 | $1,377,000 | $510,000 | $867,000 |
| 2019 | $18,879 | $1,350,000 | $500,000 | $850,000 |
| 2018 | $17,283 | $1,224,000 | $408,000 | $816,000 |
| 2017 | $11,622 | $781,617 | $234,485 | $547,132 |
| 2016 | $11,243 | $766,291 | $229,887 | $536,404 |
| 2015 | $11,091 | $754,784 | $226,435 | $528,349 |
| 2014 | $10,960 | $740,000 | $222,000 | $518,000 |
Source: Public Records
Map
Nearby Homes
- 1179 Keith Ave
- 2686 Shasta Rd
- 1375 Queens Rd
- 1155 Keeler Ave
- 1165 Cragmont Ave
- 1160 Miller Ave
- 1110 Sterling Ave
- 2893 Buena Vista Way
- 1221 Grizzly Peak Blvd
- 20 Stevenson Ave
- 230 Fairlawn Dr
- 1119 Miller Ave
- 1100 Miller Ave
- 1106 Cragmont Ave
- 2501 Rose Walk
- 1040 Park Hills Rd
- 2315 Eunice St
- 1024 Grizzly Peak Blvd
- 962 Regal Rd
- 2600 Hilgard Ave
Your Personal Tour Guide
Ask me questions while you tour the home.