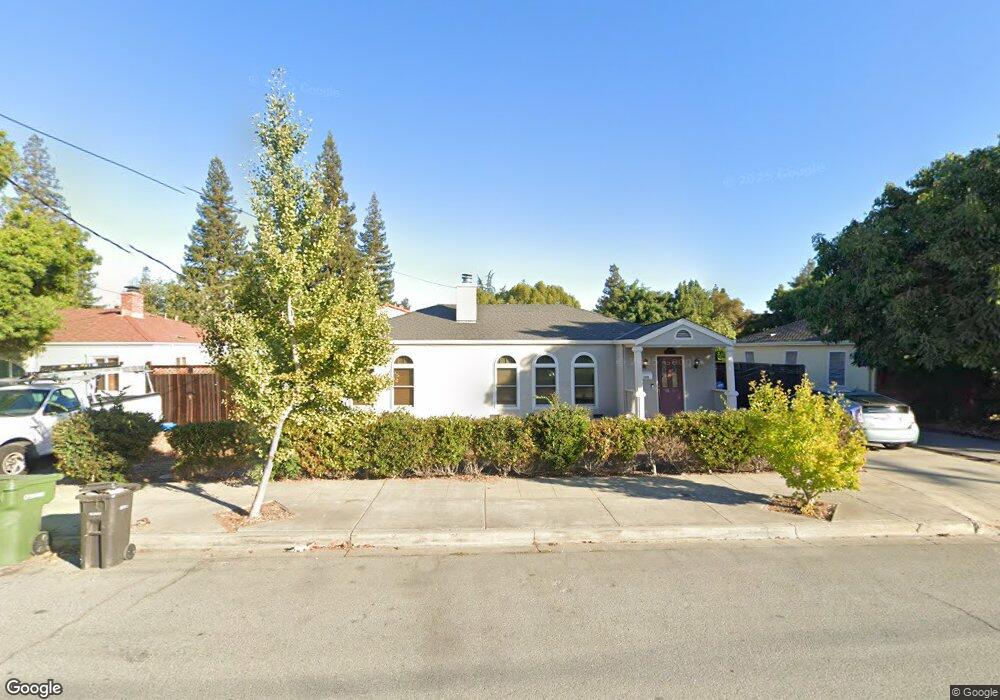
125 Cherry Ln Campbell, CA 95008
Downtown Campbell NeighborhoodEstimated Value: $1,908,000 - $2,296,000
3
Beds
2
Baths
1,231
Sq Ft
$1,701/Sq Ft
Est. Value
About This Home
This home is located at 125 Cherry Ln, Campbell, CA 95008 and is currently estimated at $2,093,973, approximately $1,701 per square foot. 125 Cherry Ln is a home located in Santa Clara County with nearby schools including Westmont High School, Campbell School of Innovation, and Capri Elementary.
Ownership History
Date
Name
Owned For
Owner Type
Purchase Details
Closed on
Aug 21, 2018
Sold by
Schnefer Philip J
Bought by
P J Schaefer Family Trust
Current Estimated Value
Purchase Details
Closed on
Oct 25, 2006
Sold by
Wienke Pilar and Wienke Andreas
Bought by
Schaefer Philip J
Home Financials for this Owner
Home Financials are based on the most recent Mortgage that was taken out on this home.
Original Mortgage
$696,000
Interest Rate
6.5%
Mortgage Type
Purchase Money Mortgage
Purchase Details
Closed on
Jan 17, 2006
Sold by
Wienke Andreas and Wienke Pilar
Bought by
Wienke Andreas and Wienke Pilar
Home Financials for this Owner
Home Financials are based on the most recent Mortgage that was taken out on this home.
Original Mortgage
$700,000
Interest Rate
6.28%
Mortgage Type
New Conventional
Purchase Details
Closed on
Apr 30, 1997
Sold by
Kinney Charles J and Kinney Alice E
Bought by
Wienke Andreas and Wienke Pilar
Home Financials for this Owner
Home Financials are based on the most recent Mortgage that was taken out on this home.
Original Mortgage
$234,000
Interest Rate
6.75%
Purchase Details
Closed on
Dec 27, 1996
Sold by
Kinney Charles J and Kinney Alice E
Bought by
Kinney Charles J and Steele Alice E
Create a Home Valuation Report for This Property
The Home Valuation Report is an in-depth analysis detailing your home's value as well as a comparison with similar homes in the area
Home Values in the Area
Average Home Value in this Area
Purchase History
| Date | Buyer | Sale Price | Title Company |
|---|---|---|---|
| P J Schaefer Family Trust | -- | None Available | |
| Schaefer Philip J | $870,000 | Stewart Title Of Ca Inc | |
| Wienke Andreas | -- | Fidelity National Title Ins | |
| Wienke Andreas | -- | Santa Clara Land Title Co | |
| Kinney Charles J | -- | Santa Clara Land Title Co |
Source: Public Records
Mortgage History
| Date | Status | Borrower | Loan Amount |
|---|---|---|---|
| Previous Owner | Schaefer Philip J | $696,000 | |
| Previous Owner | Wienke Andreas | $700,000 | |
| Previous Owner | Wienke Andreas | $234,000 |
Source: Public Records
Tax History Compared to Growth
Tax History
| Year | Tax Paid | Tax Assessment Tax Assessment Total Assessment is a certain percentage of the fair market value that is determined by local assessors to be the total taxable value of land and additions on the property. | Land | Improvement |
|---|---|---|---|---|
| 2025 | $14,781 | $1,165,264 | $873,938 | $291,326 |
| 2024 | $14,781 | $1,142,416 | $856,802 | $285,614 |
| 2023 | $14,577 | $1,120,016 | $840,002 | $280,014 |
| 2022 | $14,484 | $1,098,056 | $823,532 | $274,524 |
| 2021 | $14,224 | $1,076,527 | $807,385 | $269,142 |
| 2020 | $13,856 | $1,065,490 | $799,107 | $266,383 |
| 2019 | $13,663 | $1,044,599 | $783,439 | $261,160 |
| 2018 | $13,239 | $1,024,118 | $768,078 | $256,040 |
| 2017 | $13,053 | $1,004,038 | $753,018 | $251,020 |
| 2016 | $12,275 | $984,352 | $738,253 | $246,099 |
| 2015 | $12,074 | $969,567 | $727,164 | $242,403 |
| 2014 | $10,719 | $868,000 | $651,000 | $217,000 |
Source: Public Records
Map
Nearby Homes
- 253 W Rincon Ave
- 63 Braxton Terrace
- 120 Kennedy Ave
- 203 Wilton Dr
- 186 E Rincon Ave
- 353 W Rincon Ave Unit E
- 195 Sunnyside Ave
- 21 N 2nd St Unit 306
- 21 N 2nd St Unit 303
- 110 S 1st St Unit 110
- 238 Railway Ave
- 99 Timber Cove Dr Unit 99
- 283 Esther Ave
- 26 Timber Cove Dr Unit 26
- 341 Carlyn Ave
- 411 Dunster Dr
- 88 La Paz Way Unit 88
- 375 N 3rd St Unit 3
- 178 Salmar Terrace
- 390 N 1st St Unit 2