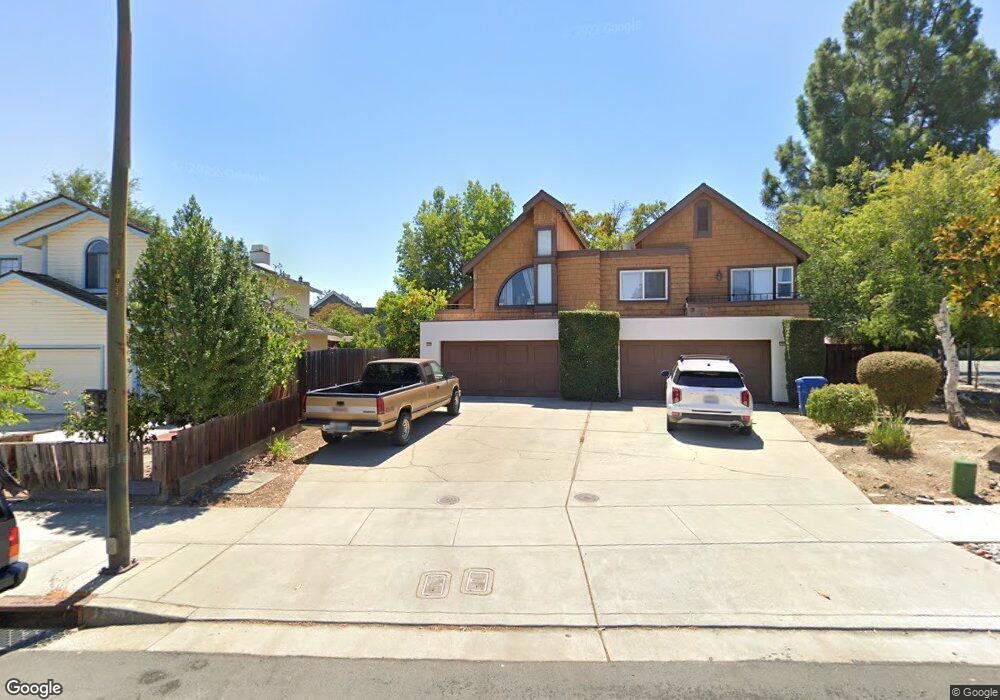
1258 Audrey Ave Campbell, CA 95008
San Tomas NeighborhoodEstimated Value: $1,524,000 - $2,316,000
2
Beds
3
Baths
1,693
Sq Ft
$1,054/Sq Ft
Est. Value
About This Home
This home is located at 1258 Audrey Ave, Campbell, CA 95008 and is currently estimated at $1,784,313, approximately $1,053 per square foot. 1258 Audrey Ave is a home located in Santa Clara County with nearby schools including Westmont High School, Village School, and Capri Elementary.
Ownership History
Date
Name
Owned For
Owner Type
Purchase Details
Closed on
Mar 24, 2022
Sold by
Stewart Hopkins Eric
Bought by
Hopkins Eric and Hopkins Trisha
Current Estimated Value
Home Financials for this Owner
Home Financials are based on the most recent Mortgage that was taken out on this home.
Original Mortgage
$292,000
Outstanding Balance
$237,323
Interest Rate
3.63%
Mortgage Type
New Conventional
Estimated Equity
$1,546,990
Purchase Details
Closed on
Dec 5, 2002
Sold by
Hopkins Eric Stewart and Hopkins Arthur Stewart
Bought by
Hopkins Eric Stewart
Home Financials for this Owner
Home Financials are based on the most recent Mortgage that was taken out on this home.
Original Mortgage
$322,700
Interest Rate
6.03%
Purchase Details
Closed on
Jul 15, 1999
Sold by
Hopkins Arthur S
Bought by
Hopkins Eric Stewart and Hopkins Arthur Stewart
Home Financials for this Owner
Home Financials are based on the most recent Mortgage that was taken out on this home.
Original Mortgage
$270,000
Interest Rate
6.75%
Create a Home Valuation Report for This Property
The Home Valuation Report is an in-depth analysis detailing your home's value as well as a comparison with similar homes in the area
Home Values in the Area
Average Home Value in this Area
Purchase History
| Date | Buyer | Sale Price | Title Company |
|---|---|---|---|
| Hopkins Eric | $146,000 | New Title Company Name | |
| Hopkins Eric Stewart | -- | Fidelity National Title Ins | |
| Hopkins Eric Stewart | $267,500 | Fidelity National Title Co |
Source: Public Records
Mortgage History
| Date | Status | Borrower | Loan Amount |
|---|---|---|---|
| Open | Hopkins Eric | $292,000 | |
| Previous Owner | Hopkins Eric Stewart | $322,700 | |
| Previous Owner | Hopkins Eric Stewart | $270,000 |
Source: Public Records
Tax History
| Year | Tax Paid | Tax Assessment Tax Assessment Total Assessment is a certain percentage of the fair market value that is determined by local assessors to be the total taxable value of land and additions on the property. | Land | Improvement |
|---|---|---|---|---|
| 2025 | $6,355 | $453,357 | $169,742 | $283,615 |
| 2024 | $6,355 | $444,468 | $166,414 | $278,054 |
| 2023 | $6,275 | $435,753 | $163,151 | $272,602 |
| 2022 | $6,186 | $427,209 | $159,952 | $267,257 |
| 2021 | $6,060 | $418,833 | $156,816 | $262,017 |
| 2020 | $5,895 | $414,540 | $155,209 | $259,331 |
| 2019 | $5,799 | $406,413 | $152,166 | $254,247 |
| 2018 | $5,615 | $398,445 | $149,183 | $249,262 |
| 2017 | $5,522 | $390,633 | $146,258 | $244,375 |
| 2016 | $5,189 | $382,975 | $143,391 | $239,584 |
| 2015 | $5,083 | $377,224 | $141,238 | $235,986 |
| 2014 | $4,854 | $369,836 | $138,472 | $231,364 |
Source: Public Records
Map
Nearby Homes
- 320 Pine Wood Ln
- 14225 Lora Dr Unit 17
- 14225 Lora Dr Unit 51
- 14355 La Rinconada Dr
- 1430 Westmont Ave
- 810 Virginia Ct
- 380 School Ct
- 872 Loyalton Dr
- 576 W Parr Ave Unit 9
- 576 W Parr Ave Unit 3
- 1177 Smith Ave
- 207 Palmer Dr
- 1285 Capri Dr
- 963 Connie Dr
- 832 Mary Ct
- 803 W Sunnyoaks Ave
- 227 Casitas Bulevar
- 734 Pecan Way
- 1500 W San Tomas Aquino Rd
- 786 Sharmon Palms Ln
- 1260 Audrey Ave
- 1256 Audrey Ave
- 1275 Pollard Rd
- 1490 Burrows Rd
- 1251 Bracebridge Ct
- 1255 Bracebridge Ct
- 1248 Audrey Ave
- 1247 Bracebridge Ct
- 1243 Bracebridge Ct
- 1239 Bracebridge Ct
- 1448 Burrows Rd
- 1240 Audrey Ave
- 1511 Burrows Rd
- 1461 Burrows Rd
- 1255 Audrey Ave
- 1235 Bracebridge Ct
- 1233 Bracebridge Ct
- 1247 Audrey Ave
- 1230 Audrey Ave
- 1313 Pollard Rd
Your Personal Tour Guide
Ask me questions while you tour the home.