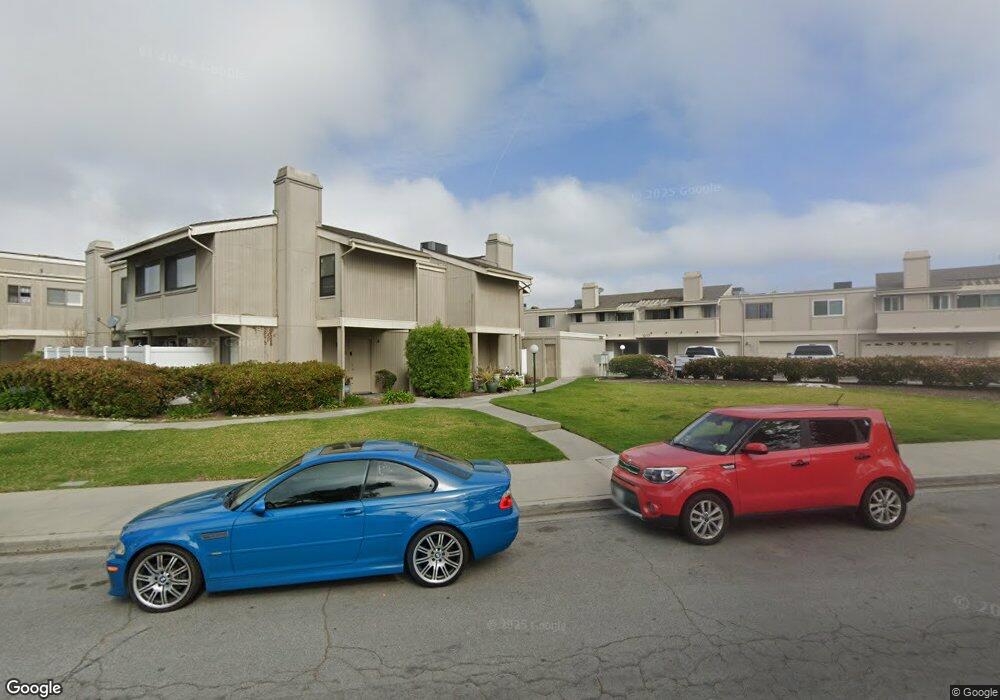
1276 Seacliff Ct Unit 5 Ventura, CA 93003
Thille NeighborhoodEstimated Value: $526,298 - $713,000
3
Beds
3
Baths
1,226
Sq Ft
$477/Sq Ft
Est. Value
About This Home
This home is located at 1276 Seacliff Ct Unit 5, Ventura, CA 93003 and is currently estimated at $584,325, approximately $476 per square foot. 1276 Seacliff Ct Unit 5 is a home located in Ventura County with nearby schools including Elmhurst Elementary School, Anacapa Middle School, and Buena High School.
Ownership History
Date
Name
Owned For
Owner Type
Purchase Details
Closed on
May 22, 2023
Sold by
Sturtz Maria I
Bought by
Sturtz Larry L
Current Estimated Value
Purchase Details
Closed on
Jun 30, 2007
Sold by
Sturtz Larry L and Sturtz Maria I
Bought by
Sturtz Larry L and Sturtz Maria I
Home Financials for this Owner
Home Financials are based on the most recent Mortgage that was taken out on this home.
Original Mortgage
$152,458
Interest Rate
6.73%
Mortgage Type
New Conventional
Purchase Details
Closed on
Mar 19, 1997
Sold by
Federal Home Loan Mortgage Corporation
Bought by
Sturtz Larry L
Home Financials for this Owner
Home Financials are based on the most recent Mortgage that was taken out on this home.
Original Mortgage
$103,400
Interest Rate
7.63%
Purchase Details
Closed on
Aug 5, 1996
Sold by
Duplantis Michael C and Scheffler Billie J
Bought by
Federal Home Loan Mortgage Corporation
Create a Home Valuation Report for This Property
The Home Valuation Report is an in-depth analysis detailing your home's value as well as a comparison with similar homes in the area
Home Values in the Area
Average Home Value in this Area
Purchase History
| Date | Buyer | Sale Price | Title Company |
|---|---|---|---|
| Sturtz Larry L | -- | None Listed On Document | |
| Sturtz Larry L | -- | None Available | |
| Sturtz Larry L | $115,000 | Lawyers Title Company | |
| Federal Home Loan Mortgage Corporation | $105,000 | First American Title Ins Co |
Source: Public Records
Mortgage History
| Date | Status | Borrower | Loan Amount |
|---|---|---|---|
| Previous Owner | Sturtz Larry L | $152,458 | |
| Previous Owner | Sturtz Larry L | $103,400 |
Source: Public Records
Tax History Compared to Growth
Tax History
| Year | Tax Paid | Tax Assessment Tax Assessment Total Assessment is a certain percentage of the fair market value that is determined by local assessors to be the total taxable value of land and additions on the property. | Land | Improvement |
|---|---|---|---|---|
| 2025 | $2,067 | $187,098 | $74,835 | $112,263 |
| 2024 | $2,067 | $183,430 | $73,368 | $110,062 |
| 2023 | $1,968 | $179,834 | $71,930 | $107,904 |
| 2022 | $1,831 | $176,308 | $70,519 | $105,789 |
| 2021 | $1,799 | $172,851 | $69,136 | $103,715 |
| 2020 | $1,782 | $171,080 | $68,428 | $102,652 |
| 2019 | $1,749 | $167,727 | $67,087 | $100,640 |
| 2018 | $1,720 | $164,439 | $65,772 | $98,667 |
| 2017 | $1,688 | $161,216 | $64,483 | $96,733 |
| 2016 | $1,657 | $158,056 | $63,219 | $94,837 |
| 2015 | $1,631 | $155,683 | $62,270 | $93,413 |
| 2014 | $1,607 | $152,635 | $61,051 | $91,584 |
Source: Public Records
Map
Nearby Homes
- 1275 Seacliff Ct Unit 5
- 1274 San Simeon Ct Unit 1
- 1251 San Simeon Ct Unit 7
- 1466 San Simeon Ct Unit 2
- 1466 San Simeon Ct Unit 4
- 1323 Bluebird Ave
- 1497 Lark Ave
- 871 Miller Ct
- 1300 Saratoga Ave Unit 805
- 1300 Saratoga Ave Unit 401
- 1300 Saratoga Ave Unit 601
- 1300 Saratoga Ave Unit 1712
- 1300 Saratoga Ave Unit 306
- 1300 Saratoga Ave Unit 302
- 6313 Mockingbird St
- 1177 Saratoga Ave Unit 2
- 5246 Shenandoah St
- 5251 Teton Ln
- 1740 Tanager St Unit 2303
- 5197 Teton Ln
- 1276 Seacliff Ct Unit 3
- 1276 Seacliff Ct Unit 122
- 1276 Seacliff Ct Unit 120
- 1276 Seacliff Ct Unit 2
- 1276 Seacliff Ct Unit 7
- 1276 Seacliff Ct Unit 6
- 1276 Seacliff Ct Unit 4
- 1280 Seacliff Ct
- 1280 Seacliff Ct Unit 5
- 1280 Seacliff Ct Unit 3
- 1280 Seacliff Ct Unit 4
- 1280 Seacliff Ct Unit 6
- 1280 Seacliff Ct Unit 7
- 1280 Seacliff Ct Unit 2
- 1280 Seacliff Ct Unit 1
- 1254 Seacliff Ct Unit 3
- 1254 Seacliff Ct Unit 6
- 1254 Seacliff Ct
- 1254 Seacliff Ct Unit 7
- 1254 Seacliff Ct Unit 4