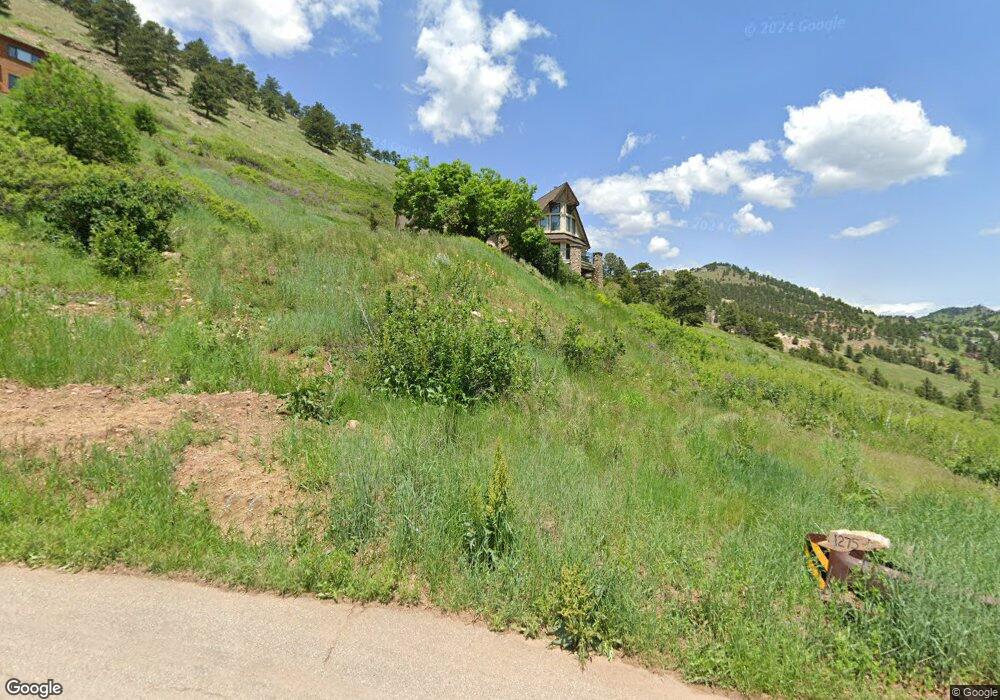
1285 N Cedar Brook Rd Boulder, CO 80304
Pine Brook Hill NeighborhoodEstimated Value: $1,693,000 - $2,151,337
4
Beds
4
Baths
3,673
Sq Ft
$540/Sq Ft
Est. Value
About This Home
This home is located at 1285 N Cedar Brook Rd, Boulder, CO 80304 and is currently estimated at $1,984,834, approximately $540 per square foot. 1285 N Cedar Brook Rd is a home located in Boulder County with nearby schools including Foothill Elementary School, Centennial Middle School, and Boulder High School.
Ownership History
Date
Name
Owned For
Owner Type
Purchase Details
Closed on
Nov 30, 2017
Sold by
Smith Robert James and Smith Robert James
Bought by
Smith Robert James
Current Estimated Value
Purchase Details
Closed on
May 30, 2001
Sold by
Smith Robert James and Smith Judith Ann
Bought by
Smith Robert James
Purchase Details
Closed on
Oct 25, 2000
Sold by
Smith Judith Ann
Bought by
Smith Robert James
Purchase Details
Closed on
Jul 25, 1997
Sold by
Smith Judith Ann
Bought by
Smith Robert James
Home Financials for this Owner
Home Financials are based on the most recent Mortgage that was taken out on this home.
Original Mortgage
$350,000
Interest Rate
5.75%
Purchase Details
Closed on
Oct 20, 1992
Bought by
Smith Robert James Revoc Trst Udt & Judi
Purchase Details
Closed on
Oct 26, 1988
Bought by
Smith Robert James Revoc Trst Udt & Judi
Create a Home Valuation Report for This Property
The Home Valuation Report is an in-depth analysis detailing your home's value as well as a comparison with similar homes in the area
Home Values in the Area
Average Home Value in this Area
Purchase History
| Date | Buyer | Sale Price | Title Company |
|---|---|---|---|
| Smith Robert James | -- | None Available | |
| Smith Robert James | -- | -- | |
| Smith Robert James | -- | -- | |
| Smith Robert James | -- | -- | |
| Smith Robert James Revoc Trst Udt & Judi | -- | -- | |
| Smith Robert James Revoc Trst Udt & Judi | $154,000 | -- |
Source: Public Records
Mortgage History
| Date | Status | Borrower | Loan Amount |
|---|---|---|---|
| Previous Owner | Smith Robert James | $350,000 |
Source: Public Records
Tax History Compared to Growth
Tax History
| Year | Tax Paid | Tax Assessment Tax Assessment Total Assessment is a certain percentage of the fair market value that is determined by local assessors to be the total taxable value of land and additions on the property. | Land | Improvement |
|---|---|---|---|---|
| 2025 | $10,621 | $115,669 | $20,406 | $95,263 |
| 2024 | $10,621 | $115,669 | $20,406 | $95,263 |
| 2023 | $10,447 | $123,930 | $20,656 | $106,959 |
| 2022 | $8,701 | $96,355 | $16,534 | $79,821 |
| 2021 | $8,280 | $99,128 | $17,010 | $82,118 |
| 2020 | $7,536 | $88,531 | $23,166 | $65,365 |
| 2019 | $7,420 | $88,531 | $23,166 | $65,365 |
| 2018 | $6,724 | $79,452 | $15,552 | $63,900 |
| 2017 | $6,521 | $87,839 | $17,194 | $70,645 |
| 2016 | $6,770 | $71,505 | $15,522 | $55,983 |
| 2015 | $5,622 | $52,233 | $17,854 | $34,379 |
| 2014 | $7,520 | $75,692 | $25,870 | $49,822 |
Source: Public Records
Map
Nearby Homes
- 1280 N Cedar Brook Rd
- 71 Ridge Dr
- 634 Fountaintree Ln
- 228 Lion Point
- 166 Valley View Way
- 746 Bow Mountain Rd
- 50 Wildwood Ln
- 1037 Wagonwheel Gap Rd
- 2990 Linden Dr
- 2857 Linden Dr
- 93 Pine Needle Rd
- 5384 Olde Stage Rd
- 1573 Linden Dr
- 1575 Linden Dr
- 1577 Linden Dr
- 5318 5th St Unit D
- 700 Hill St
- 789 Zamia Ave
- 2554 Linden Dr
- 4921 Fountain St
- 1257 N Cedar Brook Rd
- 1275 N Cedar Brook Rd
- 1253 N Cedar Brook Rd
- 1234 N Cedar Brook Rd
- 1131 N Cedar Brook Rd
- 1332 N Cedar Brook Rd
- 1306 N Cedar Brook Rd
- 1204 N Cedar Brook Rd
- 1105 N Cedar Brook Rd
- 1326 N Cedar Brook Rd
- 1043 N Cedar Brook Rd Unit 4
- 0 Ridge Dr
- 36 Ridge Dr
- 901 N Cedar Brook Rd
- 100 Ridge Dr
- 98 Ridge Dr
- 1011 N Cedar Brook Rd Unit 4
- 1016 N Cedar Brook Rd
- 171 Valley View Way
- 997 N Cedar Brook Rd