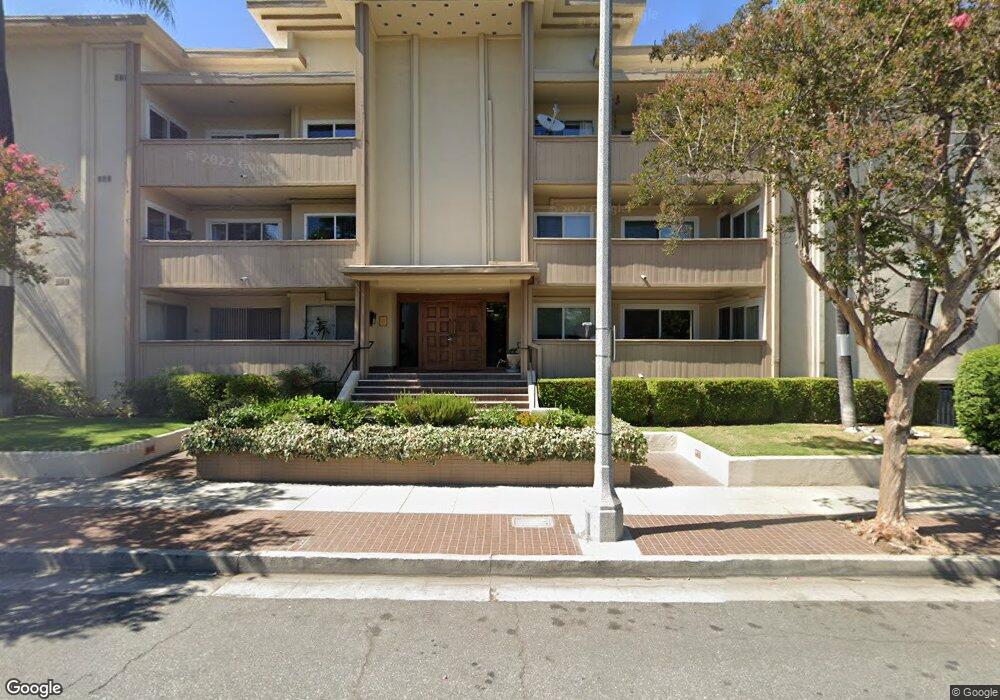
1299 Cordova St Unit 306 Pasadena, CA 91106
Playhouse Village NeighborhoodEstimated Value: $562,000 - $690,000
1
Bed
1
Bath
899
Sq Ft
$665/Sq Ft
Est. Value
About This Home
This home is located at 1299 Cordova St Unit 306, Pasadena, CA 91106 and is currently estimated at $597,816, approximately $664 per square foot. 1299 Cordova St Unit 306 is a home located in Los Angeles County with nearby schools including McKinley School, Blair High School, and International School of Los Angeles-Pasadena.
Ownership History
Date
Name
Owned For
Owner Type
Purchase Details
Closed on
Oct 30, 2006
Sold by
Bailey Elizabeth
Bought by
Dyer Ian Allen
Current Estimated Value
Purchase Details
Closed on
Oct 24, 2006
Sold by
Dyer Ian Allen
Bought by
Branson Z Clark and Z Clark Branson Trust
Purchase Details
Closed on
Jul 26, 2004
Sold by
Alford Kimberly
Bought by
Dyer Ian Allen
Home Financials for this Owner
Home Financials are based on the most recent Mortgage that was taken out on this home.
Original Mortgage
$214,400
Interest Rate
5.25%
Mortgage Type
New Conventional
Purchase Details
Closed on
Jul 7, 2000
Sold by
Trigg Deanne
Bought by
Alford Kimberly
Home Financials for this Owner
Home Financials are based on the most recent Mortgage that was taken out on this home.
Original Mortgage
$107,500
Interest Rate
8.19%
Purchase Details
Closed on
Mar 21, 2000
Sold by
Saladino Mark J and Estate Of Thelma Vanover
Bought by
Trigg Deanne
Create a Home Valuation Report for This Property
The Home Valuation Report is an in-depth analysis detailing your home's value as well as a comparison with similar homes in the area
Home Values in the Area
Average Home Value in this Area
Purchase History
| Date | Buyer | Sale Price | Title Company |
|---|---|---|---|
| Dyer Ian Allen | -- | California Title | |
| Branson Z Clark | $363,000 | California Title | |
| Dyer Ian Allen | $268,000 | Southland Title | |
| Alford Kimberly | $107,500 | Fidelity Title | |
| Trigg Deanne | $80,000 | Fidelity Title |
Source: Public Records
Mortgage History
| Date | Status | Borrower | Loan Amount |
|---|---|---|---|
| Previous Owner | Dyer Ian Allen | $214,400 | |
| Previous Owner | Alford Kimberly | $107,500 | |
| Closed | Dyer Ian Allen | $26,800 |
Source: Public Records
Tax History Compared to Growth
Tax History
| Year | Tax Paid | Tax Assessment Tax Assessment Total Assessment is a certain percentage of the fair market value that is determined by local assessors to be the total taxable value of land and additions on the property. | Land | Improvement |
|---|---|---|---|---|
| 2025 | $5,504 | $486,325 | $352,357 | $133,968 |
| 2024 | $5,504 | $476,791 | $345,449 | $131,342 |
| 2023 | $5,456 | $467,443 | $338,676 | $128,767 |
| 2022 | $5,267 | $458,279 | $332,036 | $126,243 |
| 2021 | $5,052 | $449,294 | $325,526 | $123,768 |
| 2019 | $4,862 | $435,970 | $315,872 | $120,098 |
| 2018 | $4,972 | $427,423 | $309,679 | $117,744 |
| 2016 | $4,386 | $373,000 | $271,000 | $102,000 |
| 2015 | $4,109 | $347,000 | $252,000 | $95,000 |
| 2014 | $3,856 | $325,000 | $236,000 | $89,000 |
Source: Public Records
Map
Nearby Homes
- 202 S Holliston Ave Unit 301
- 160 S Michigan Ave
- 1156 Steuben St
- 1115 Cordova St Unit 207
- 195 S Wilson Ave
- 137 S Wilson Ave Unit 110
- 137 S Wilson Ave Unit 105
- 137 S Wilson Ave Unit 106
- 137 S Wilson Ave Unit 107
- 64 N Mar Vista Ave Unit 231
- 1000 Cordova St Unit 101
- 70 Harkness Ave Unit 4
- 120 S Mentor Ave Unit 202
- 965 E Del Mar Blvd Unit 3
- 1637 Rose Villa St
- 99 N Catalina Ave Unit 8
- 99 N Catalina Ave Unit 1
- 671 675 S Euclid Ave
- 103 N Catalina Ave
- 236 N Michigan Ave
- 1299 Cordova St Unit 401
- 1299 Cordova St Unit 400
- 1299 Cordova St Unit 308
- 1299 Cordova St Unit 307
- 1299 Cordova St Unit 305
- 1299 Cordova St Unit 304
- 1299 Cordova St Unit 303
- 1299 Cordova St Unit 302
- 1299 Cordova St Unit 301
- 1299 Cordova St Unit 300
- 1299 Cordova St Unit 309
- 1299 Cordova St Unit 208
- 1299 Cordova St Unit 207
- 1299 Cordova St Unit 206
- 1299 Cordova St Unit 205
- 1299 Cordova St Unit 204
- 1299 Cordova St Unit 203
- 1299 Cordova St Unit 202
- 1299 Cordova St Unit 201
- 1299 Cordova St Unit 200