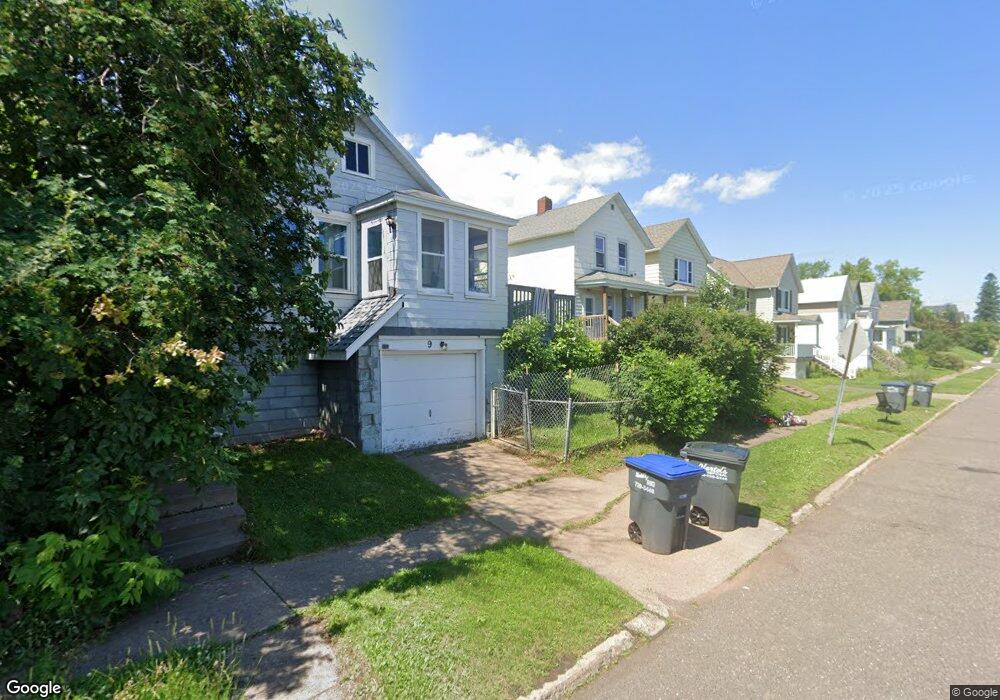
13 E 8th St Duluth, MN 55805
Central Hillside NeighborhoodEstimated Value: $172,000 - $206,000
3
Beds
2
Baths
1,388
Sq Ft
$138/Sq Ft
Est. Value
About This Home
This home is located at 13 E 8th St, Duluth, MN 55805 and is currently estimated at $191,207, approximately $137 per square foot. 13 E 8th St is a home located in St. Louis County with nearby schools including Myers-Wilkins Elementary, Lincoln Park Middle School, and Denfeld High School.
Ownership History
Date
Name
Owned For
Owner Type
Purchase Details
Closed on
Jan 30, 2026
Sold by
Artavia Capital Llc
Bought by
Tsk Ventures Llc
Current Estimated Value
Purchase Details
Closed on
May 10, 2024
Sold by
Scholz Jordan and Fanning Jordan
Bought by
Artavia Capital Llc
Purchase Details
Closed on
Sep 14, 2021
Sold by
Zachow Donald C and Zachow Elsie E
Bought by
Scholz Dustin and Scholz Jordan
Home Financials for this Owner
Home Financials are based on the most recent Mortgage that was taken out on this home.
Original Mortgage
$140,000
Interest Rate
6%
Mortgage Type
Land Contract Argmt. Of Sale
Create a Home Valuation Report for This Property
The Home Valuation Report is an in-depth analysis detailing your home's value as well as a comparison with similar homes in the area
Home Values in the Area
Average Home Value in this Area
Purchase History
| Date | Buyer | Sale Price | Title Company |
|---|---|---|---|
| Tsk Ventures Llc | -- | First American Title | |
| Artavia Capital Llc | $150,000 | First American Title | |
| Fanning Jordan | $145,000 | First American Title | |
| Fanning Jordan | $500 | First American Title | |
| Scholz Dustin | $145,000 | Minnesota Ttl & Abstract Co |
Source: Public Records
Mortgage History
| Date | Status | Borrower | Loan Amount |
|---|---|---|---|
| Previous Owner | Scholz Dustin | $140,000 |
Source: Public Records
Tax History
| Year | Tax Paid | Tax Assessment Tax Assessment Total Assessment is a certain percentage of the fair market value that is determined by local assessors to be the total taxable value of land and additions on the property. | Land | Improvement |
|---|---|---|---|---|
| 2024 | $2,576 | $186,700 | $23,800 | $162,900 |
| 2023 | $2,576 | $166,300 | $28,400 | $137,900 |
| 2022 | $2,926 | $153,100 | $26,300 | $126,800 |
| 2021 | $1,464 | $103,900 | $21,900 | $82,000 |
| 2020 | $1,372 | $89,500 | $18,900 | $70,600 |
| 2019 | $1,362 | $81,400 | $17,100 | $64,300 |
| 2018 | $1,260 | $81,400 | $17,100 | $64,300 |
| 2017 | $1,262 | $80,400 | $17,100 | $63,300 |
| 2016 | $1,232 | $171,200 | $55,500 | $115,700 |
| 2015 | $1,253 | $80,700 | $4,300 | $76,400 |
| 2014 | $1,253 | $80,700 | $4,300 | $76,400 |
Source: Public Records
Map
Nearby Homes
- 523 N 1st Ave E
- 202 E 7th St Unit D
- 609 N 4th Ave E
- 409 E 6th St
- 1126 Mesaba Ave Unit 119
- 517 E 5th St
- 311 E Superior St Unit 704
- 311 E Superior St Unit 905
- 311 E Superior St
- 1125 N 7th Ave E
- 706 E 11th St
- 628 W 3rd St
- 722 E 3rd St
- 814 W 5th St
- 908 E Skyline Pkwy
- XXX E Ninth St
- 1027 E 9th St
- 1023 E 5th St
- 902 N 11th Ave E
- 1025 W 8th St
Your Personal Tour Guide
Ask me questions while you tour the home.