13 Josephs Crossing Hampton, VA 23669
Willow Oaks NeighborhoodEstimated Value: $332,000 - $353,000
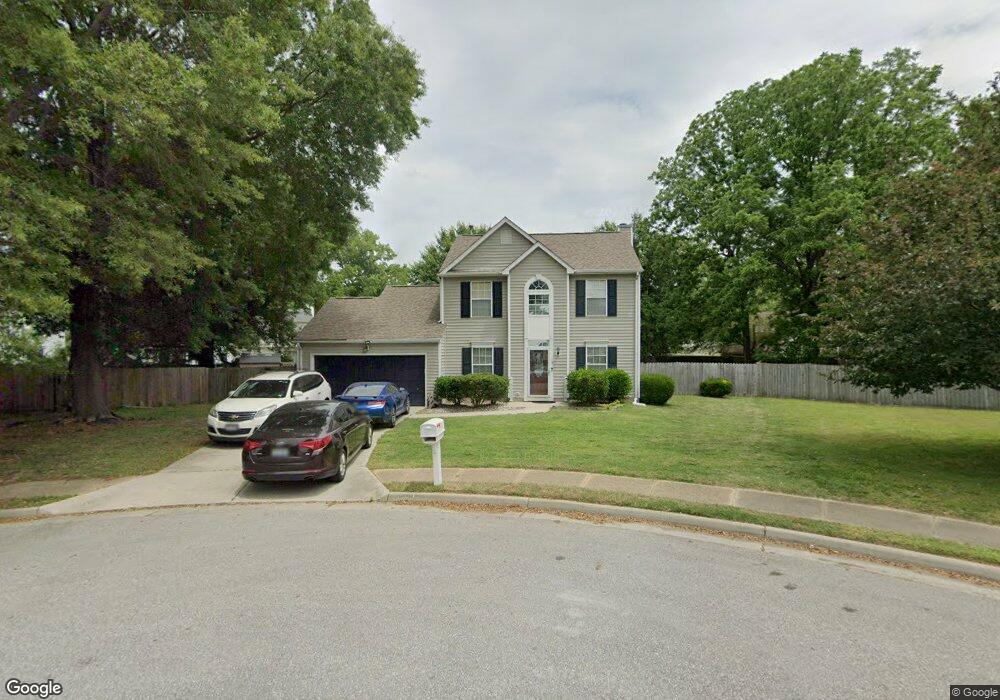
About This Home
This home is located at 13 Josephs Crossing, Hampton, VA 23669 and is currently estimated at $344,090, approximately $220 per square foot. 13 Josephs Crossing is a home located in Hampton City with nearby schools including Mary S. Peake Elementary School, C. Alton Lindsay Middle School, and Hampton High School.
Ownership History
We collect this data history from publicly available records. To have your information removed, we recommend requesting removal directly through your county’s website.
Purchase Details
Home Financials for this Owner
Home Financials are based on the most recent Mortgage that was taken out on this home.Purchase Details
Home Financials for this Owner
Home Financials are based on the most recent Mortgage that was taken out on this home.Purchase Details
Home Financials for this Owner
Home Financials are based on the most recent Mortgage that was taken out on this home.Purchase Details
Home Financials for this Owner
Home Financials are based on the most recent Mortgage that was taken out on this home.Home Values in the Area
Average Home Value in this Area
Purchase History
We collect this data history from publicly available records. To have your information removed, we recommend requesting removal directly through your county’s website.
| Date | Buyer | Sale Price | Title Company |
|---|---|---|---|
| $235,000 | Attorney | ||
| $215,500 | -- | ||
| $176,400 | -- | ||
| $117,700 | -- |
Mortgage History
We collect this data history from publicly available records. To have your information removed, we recommend requesting removal directly through your county’s website.
| Date | Status | Borrower | Loan Amount |
|---|---|---|---|
| Open | $230,743 | ||
| Previous Owner | $220,100 | ||
| Previous Owner | $180,192 | ||
| Previous Owner | $116,813 |
Tax History
We collect this data history from publicly available records. To have your information removed, we recommend requesting removal directly through your county’s website.
| Year | Tax Paid | Tax Assessment Tax Assessment Total Assessment is a certain percentage of the fair market value that is determined by local assessors to be the total taxable value of land and additions on the property. | Land | Improvement |
|---|---|---|---|---|
| 2025 | $3,706 | $311,600 | $72,000 | $239,600 |
| 2024 | $3,471 | $301,800 | $70,000 | $231,800 |
| 2023 | $3,481 | $300,100 | $70,000 | $230,100 |
| 2022 | $3,211 | $272,100 | $70,000 | $202,100 |
| 2021 | $3,038 | $234,500 | $65,000 | $169,500 |
| 2020 | $2,730 | $220,200 | $65,000 | $155,200 |
| 2019 | $2,572 | $207,400 | $65,000 | $142,400 |
| 2018 | $2,553 | $196,000 | $62,200 | $133,800 |
| 2017 | $2,524 | $0 | $0 | $0 |
| 2016 | $2,524 | $196,000 | $0 | $0 |
| 2015 | $2,524 | $0 | $0 | $0 |
| 2014 | $2,514 | $196,000 | $62,200 | $133,800 |
Map
- 16 Josephs Crossing
- 8 Clover St
- 43 Hampshire Dr
- 12 Kingslee Ln
- 23 Clover St
- 15 King Kove Ln
- 107 Rosewood Dr
- 35 Westover St
- 34 Westover St
- 71 Waters Edge Cir
- 67 W Little Back River Rd
- 218 Pine Grove Ave
- 32 Riverchase Dr
- 135 Roland Dr
- 6 Valirey Dr
- 319 Pasture Ln
- 6 Westover St
- 107 Willis Church Yard
- 7 White Oak Trail
- 409 Shoreline Dr
- 105 Boeing Ave
- 11 Josephs Crossing
- 107 Boeing Ave
- 7 Sperry Ct
- 11 Sperry Ct
- 109 Boeing Ave
- 9 Josephs Crossing
- 5 Sperry Ct
- 13 Sperry Ct
- 14 Josephs Crossing
- 12 Josephs Crossing
- 1 Sperry Ct
- 7 Josephs Crossing
- 10 Josephs Crossing
- 108 Boeing Ave
- 110 Boeing Ave
- 8 Josephs Crossing
- 112 Boeing Ave
- 31 W Lamington Rd
- 33 W Lamington Rd
Ask me questions while you tour the home.