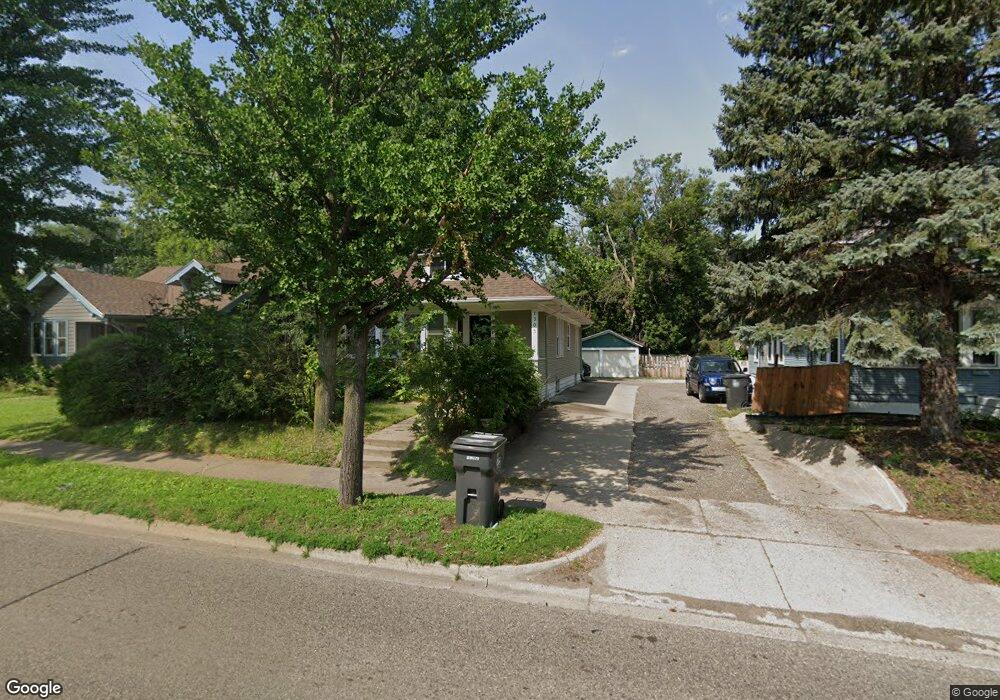
1303 White Bear Ave N Saint Paul, MN 55106
Prosperity Heights NeighborhoodEstimated Value: $257,000 - $273,000
3
Beds
1
Bath
1,203
Sq Ft
$220/Sq Ft
Est. Value
About This Home
This home is located at 1303 White Bear Ave N, Saint Paul, MN 55106 and is currently estimated at $264,390, approximately $219 per square foot. 1303 White Bear Ave N is a home located in Ramsey County with nearby schools including The Heights Community School, Battle Creek Middle School, and Johnson Senior High School.
Ownership History
Date
Name
Owned For
Owner Type
Purchase Details
Closed on
Apr 17, 2020
Sold by
Maro R Aranda Llc
Bought by
Racine Shirley
Current Estimated Value
Home Financials for this Owner
Home Financials are based on the most recent Mortgage that was taken out on this home.
Original Mortgage
$211,105
Outstanding Balance
$186,658
Interest Rate
3.3%
Mortgage Type
FHA
Estimated Equity
$77,732
Purchase Details
Closed on
Jun 11, 2019
Sold by
Lor Cham and Lor Mai Xong
Bought by
Mario R Randa Llc
Home Financials for this Owner
Home Financials are based on the most recent Mortgage that was taken out on this home.
Original Mortgage
$148,300
Interest Rate
15%
Mortgage Type
Unknown
Purchase Details
Closed on
Nov 24, 2003
Sold by
Jung Troy D and Jung Rebecca J
Bought by
Gomez Gilberto M
Purchase Details
Closed on
Jun 25, 1998
Sold by
Maestas Geraldine A
Bought by
Jung Troy D and Jung Rebecca J
Create a Home Valuation Report for This Property
The Home Valuation Report is an in-depth analysis detailing your home's value as well as a comparison with similar homes in the area
Home Values in the Area
Average Home Value in this Area
Purchase History
| Date | Buyer | Sale Price | Title Company |
|---|---|---|---|
| Racine Shirley | $215,000 | Titlesmart Inc | |
| Mario R Randa Llc | $226,252 | Titlesmart Inc | |
| Gomez Gilberto M | $142,000 | -- | |
| Jung Troy D | $59,900 | -- |
Source: Public Records
Mortgage History
| Date | Status | Borrower | Loan Amount |
|---|---|---|---|
| Open | Racine Shirley | $211,105 | |
| Previous Owner | Mario R Randa Llc | $148,300 |
Source: Public Records
Tax History
| Year | Tax Paid | Tax Assessment Tax Assessment Total Assessment is a certain percentage of the fair market value that is determined by local assessors to be the total taxable value of land and additions on the property. | Land | Improvement |
|---|---|---|---|---|
| 2025 | $4,070 | $252,400 | $30,000 | $222,400 |
| 2023 | $4,070 | $228,600 | $25,000 | $203,600 |
| 2022 | $3,372 | $236,600 | $25,000 | $211,600 |
| 2021 | $2,644 | $193,400 | $25,000 | $168,400 |
| 2020 | $2,392 | $153,200 | $17,400 | $135,800 |
| 2019 | $2,230 | $127,300 | $17,400 | $109,900 |
| 2018 | $2,064 | $127,100 | $17,400 | $109,700 |
| 2017 | $1,766 | $120,600 | $17,400 | $103,200 |
| 2016 | $1,724 | $0 | $0 | $0 |
| 2015 | $1,432 | $107,200 | $17,400 | $89,800 |
| 2014 | $962 | $0 | $0 | $0 |
Source: Public Records
Map
Nearby Homes
- 1728 Orange Ave E
- 1732 Maryland Ave E
- 1806 Maryland Ave E
- 1729 Sherwood Ave
- 1842 Arlington Ave E
- 1144 Flandrau St
- 1822 Nevada Ave E
- 1562 Ivy Ave E
- 1093 Breen St
- 1555 Cottage Ave E
- 1964 Arlington Ave E
- 1963 Arlington Ave E
- 1406 Furness Pkwy
- 2003 Cottage Ave E
- 2014 Cottage Ave E
- 1836 Mechanic Ave
- 1874 Hoyt Ave E
- 1966 Nebraska Ave E
- 1443 Hazelwood St
- 1401 Prosperity Ave
- 1303 1303 White Bear Ave N
- 1307 1307 White Bear Ave N
- 1307 White Bear Ave N
- 1297 White Bear Ave N
- 1297 1297 White Bear Ave N
- 1291 White Bear Ave N
- 1315 White Bear Ave
- 1764 Ivy Ave E
- 1779 Hyacinth Ave E
- 1289 White Bear Ave N
- 1289 1289 White Bear-Avenue-n
- 1289 1289 White Bear Ave N
- 1290 Breen St
- 1785 Hyacinth Ave E
- 1785 1785 Hyacinth-Avenue-e
- 1743 Hyacinth Ave E
- 1283 White Bear Ave N
- 1286 Breen St
- 1754 1754 Ivy Ave E
- 1754 Ivy Ave E
Your Personal Tour Guide
Ask me questions while you tour the home.