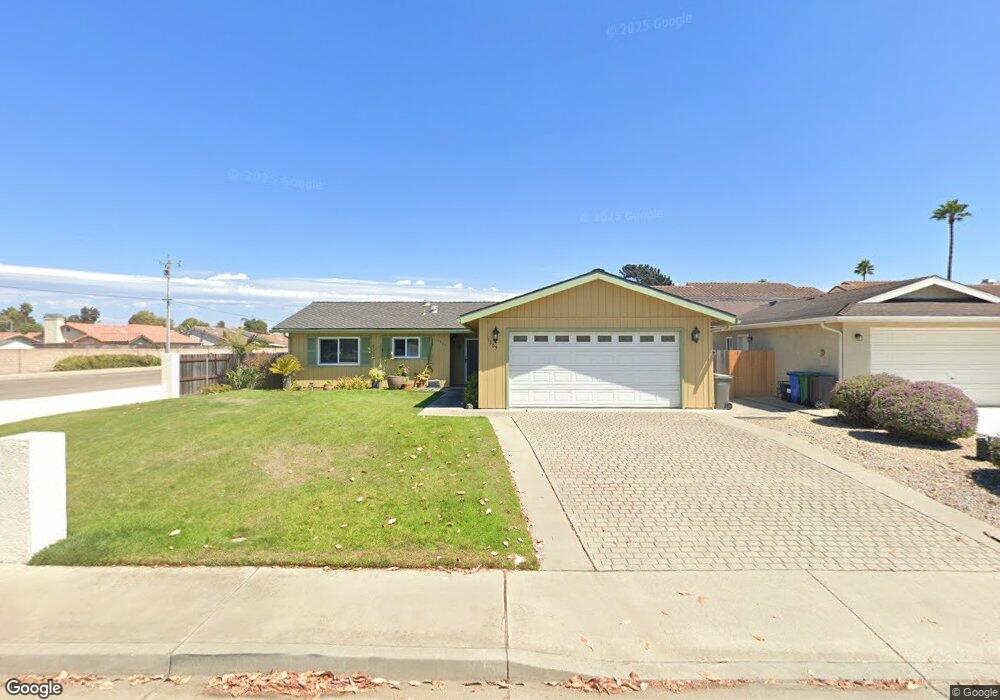
1305 Crest St Oceano, CA 93445
Oceano NeighborhoodEstimated Value: $710,000 - $832,000
3
Beds
2
Baths
1,244
Sq Ft
$597/Sq Ft
Est. Value
About This Home
This home is located at 1305 Crest St, Oceano, CA 93445 and is currently estimated at $742,430, approximately $596 per square foot. 1305 Crest St is a home located in San Luis Obispo County with nearby schools including Oceano Elementary School, Judkins Middle School, and Arroyo Grande High School.
Ownership History
Date
Name
Owned For
Owner Type
Purchase Details
Closed on
May 14, 2008
Sold by
Sasin Wesley Edward and Sasin Alice
Bought by
Sasin Wesley Edward and Sasin Alice
Current Estimated Value
Purchase Details
Closed on
May 15, 1998
Sold by
Tolbert David A and Tolbert Paul S
Bought by
Sasin Wesley Edward
Purchase Details
Closed on
Jan 31, 1996
Sold by
Tolbert Paul S and Tolbert David A
Bought by
Tolbert Paul S and Tolbert David A
Purchase Details
Closed on
Jan 4, 1996
Sold by
Beneficial California Inc
Bought by
Tolbert Paul S and Tolbert David A
Purchase Details
Closed on
Oct 4, 1995
Sold by
Tolbert Carla A
Bought by
Tolbert David A
Purchase Details
Closed on
Aug 2, 1995
Sold by
Beyer Ray J
Bought by
Beneficial California Inc
Create a Home Valuation Report for This Property
The Home Valuation Report is an in-depth analysis detailing your home's value as well as a comparison with similar homes in the area
Home Values in the Area
Average Home Value in this Area
Purchase History
| Date | Buyer | Sale Price | Title Company |
|---|---|---|---|
| Sasin Wesley Edward | -- | None Available | |
| Sasin Wesley Edward | -- | None Available | |
| Sasin Wesley Edward | -- | Chicago Title Co | |
| Tolbert Paul S | -- | -- | |
| Tolbert Paul S | -- | First American Title Ins Co | |
| Tolbert David A | -- | First American Title Ins Co | |
| Tolbert Paul S | -- | First American Title Ins Co | |
| Beneficial California Inc | $276,410 | Fidelity National Title |
Source: Public Records
Tax History
| Year | Tax Paid | Tax Assessment Tax Assessment Total Assessment is a certain percentage of the fair market value that is determined by local assessors to be the total taxable value of land and additions on the property. | Land | Improvement |
|---|---|---|---|---|
| 2025 | $2,682 | $229,497 | $107,722 | $121,775 |
| 2024 | $2,655 | $224,998 | $105,610 | $119,388 |
| 2023 | $2,655 | $220,588 | $103,540 | $117,048 |
| 2022 | $2,619 | $216,263 | $101,510 | $114,753 |
| 2021 | $2,615 | $212,023 | $99,520 | $112,503 |
| 2020 | $2,588 | $209,850 | $98,500 | $111,350 |
| 2019 | $2,572 | $205,736 | $96,569 | $109,167 |
| 2018 | $2,521 | $201,703 | $94,676 | $107,027 |
| 2017 | $2,461 | $197,749 | $92,820 | $104,929 |
| 2016 | $2,316 | $193,872 | $91,000 | $102,872 |
| 2015 | $2,050 | $190,961 | $89,634 | $101,327 |
| 2014 | -- | $187,222 | $87,879 | $99,343 |
Source: Public Records
Map
Nearby Homes
- 1277 Belridge St Unit 6A
- 1277 Belridge St Unit 1A
- 1261 San Sorrento Ct
- 1093 Belridge St
- 161 Janet Ave
- 181 Janet Ave
- 1362 Farroll Rd
- 1401 21st St
- 1515 Ocean St
- 1770 Paso Robles St
- 1681 Ocean St
- 943 Huston St
- 1935 Capistrano Ct
- 1965 Solana Ct
- 948 Huston St
- 1955 Capistrano Ct
- 1675 21st St Unit 12
- 978 Griffin St
- 2120 Paso Robles St
- 1212 Pacific Blvd
- 1311 Crest St
- 0 Avenida Pelicanos Unit LOT 441653
- 0 Avenida Pelicanos Unit LOT 441804
- 0 Avenida Pelicanos Unit LOT 441815
- 0 Avenida Pelicanos
- 1317 Crest St
- 1293 San Sorrento Ct Unit LOT
- 1293 San Sorrento Ct
- 1304 Crest St
- 1367 Cove Ct
- 1327 Crest St
- 1297 San Sorrento Ct Unit LOT
- 1297 San Sorrento Ct
- 1289 San Sorrento Ct Unit LOT
- 1289 San Sorrento Ct
- 1318 Avenida Pelicanos
- 1560 The Pike
- 1315 Avenida Pelicanos
- 1324 Avenida Pelicanos
- 1333 Crest St
Your Personal Tour Guide
Ask me questions while you tour the home.