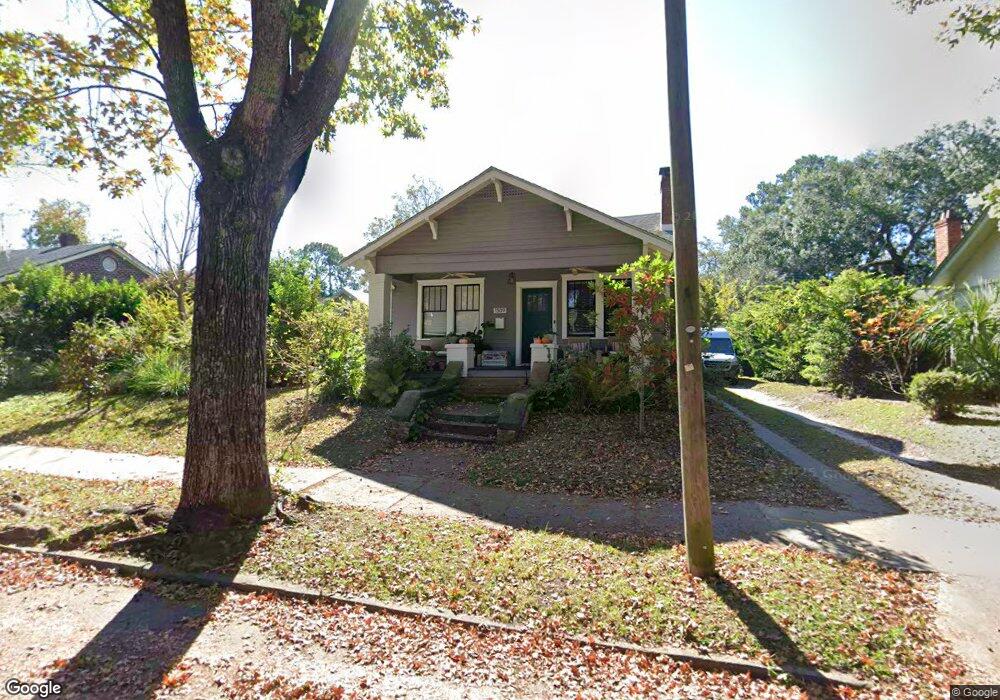
1309 E 48th St Savannah, GA 31404
Parkside NeighborhoodEstimated Value: $516,000 - $681,647
2
Beds
1
Bath
1,291
Sq Ft
$475/Sq Ft
Est. Value
About This Home
This home is located at 1309 E 48th St, Savannah, GA 31404 and is currently estimated at $613,162, approximately $474 per square foot. 1309 E 48th St is a home located in Chatham County with nearby schools including Myers Middle School, Savannah Arts Academy, and Blessed Sacrament School.
Ownership History
Date
Name
Owned For
Owner Type
Purchase Details
Closed on
Sep 11, 2013
Sold by
Hjeltness Kendall
Bought by
Harper Jonathan and Harper Andrea
Current Estimated Value
Purchase Details
Closed on
Oct 19, 2009
Sold by
Sumerlin Priscilla A
Bought by
Hjeltness Kendall and Hjeltness Verena
Home Financials for this Owner
Home Financials are based on the most recent Mortgage that was taken out on this home.
Original Mortgage
$230,743
Interest Rate
5.04%
Mortgage Type
FHA
Purchase Details
Closed on
Jun 30, 2009
Sold by
Sumerlin Priscilla A
Bought by
Summerlin Priscilla A and Jackson Lisa T
Home Financials for this Owner
Home Financials are based on the most recent Mortgage that was taken out on this home.
Original Mortgage
$73,155
Interest Rate
5.27%
Mortgage Type
New Conventional
Purchase Details
Closed on
Dec 12, 2008
Sold by
Not Provided
Bought by
Hjeltness Kendall and Hjeltness Verena
Create a Home Valuation Report for This Property
The Home Valuation Report is an in-depth analysis detailing your home's value as well as a comparison with similar homes in the area
Home Values in the Area
Average Home Value in this Area
Purchase History
| Date | Buyer | Sale Price | Title Company |
|---|---|---|---|
| Harper Jonathan | $232,000 | -- | |
| Hjeltness Kendall | $235,000 | -- | |
| Summerlin Priscilla A | -- | -- | |
| Hjeltness Kendall | -- | -- |
Source: Public Records
Mortgage History
| Date | Status | Borrower | Loan Amount |
|---|---|---|---|
| Previous Owner | Hjeltness Kendall | $230,743 | |
| Previous Owner | Summerlin Priscilla A | $73,155 |
Source: Public Records
Tax History
| Year | Tax Paid | Tax Assessment Tax Assessment Total Assessment is a certain percentage of the fair market value that is determined by local assessors to be the total taxable value of land and additions on the property. | Land | Improvement |
|---|---|---|---|---|
| 2025 | $2,071 | $323,120 | $34,000 | $289,120 |
| 2024 | $15 | $285,680 | $32,000 | $253,680 |
| 2023 | $777 | $269,400 | $26,800 | $242,600 |
| 2022 | $1,915 | $205,440 | $24,000 | $181,440 |
| 2021 | $2,812 | $162,920 | $22,240 | $140,680 |
| 2020 | $1,919 | $155,000 | $22,240 | $132,760 |
| 2019 | $2,809 | $120,400 | $22,240 | $98,160 |
| 2018 | $1,898 | $104,320 | $22,240 | $82,080 |
| 2017 | $1,723 | $97,280 | $22,240 | $75,040 |
| 2016 | $1,693 | $89,480 | $22,240 | $67,240 |
| 2015 | $2,496 | $81,120 | $21,920 | $59,200 |
| 2014 | $3,261 | $81,920 | $0 | $0 |
Source: Public Records
Map
Nearby Homes
- 1305 E 48th St
- 1313 E 48th St
- 1314 E 48th St
- 1310 E 49th St
- 1310 E 48th St
- 1306 E 49th St
- 1317 E 48th St
- 1314 E 49th St
- 1304 E 48th St
- 1316 E 48th St
- 1302 E 49th St
- 1316 E 49th St
- 1315 Washington Ave
- 1311 Washington Ave
- 1318 E 49th St
- 1322 E 48th St
- 1325 E 48th St
- 1235 E 48th St
- 1301 Washington Ave
- 3301 Cedar St
Your Personal Tour Guide
Ask me questions while you tour the home.