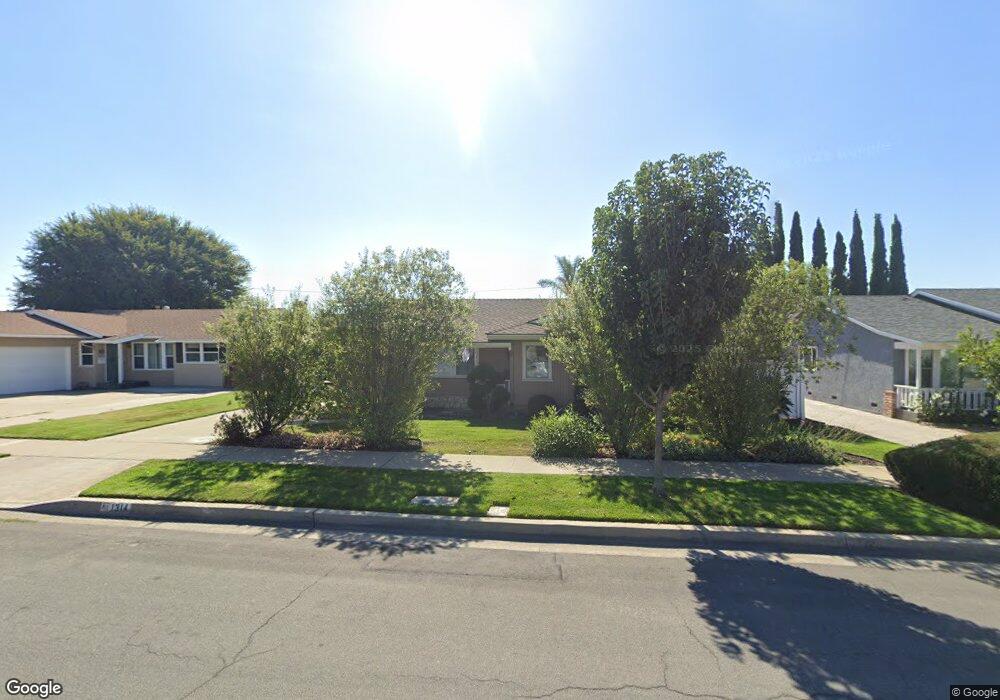
1314 E Chalynn Ave Orange, CA 92866
Estimated Value: $1,093,000 - $1,168,000
3
Beds
2
Baths
1,493
Sq Ft
$768/Sq Ft
Est. Value
About This Home
This home is located at 1314 E Chalynn Ave, Orange, CA 92866 and is currently estimated at $1,146,007, approximately $767 per square foot. 1314 E Chalynn Ave is a home located in Orange County with nearby schools including Palmyra GATE Magnet, Yorba Middle School, and Orange High School.
Ownership History
Date
Name
Owned For
Owner Type
Purchase Details
Closed on
Jun 17, 2024
Sold by
Cliburn Scott H and Ritter Dawn
Bought by
Cliburn-Ritter Revocable Living Trust and Cliburn
Current Estimated Value
Purchase Details
Closed on
Feb 9, 2009
Sold by
Mcnitt Marjorie
Bought by
Cliburn Scott H and Ritter Dawn
Home Financials for this Owner
Home Financials are based on the most recent Mortgage that was taken out on this home.
Original Mortgage
$356,000
Interest Rate
5.08%
Mortgage Type
Purchase Money Mortgage
Purchase Details
Closed on
May 12, 2008
Sold by
Mcnitt Marjorie
Bought by
Mcnitt Marjorie and Trust A Of The Donaldson Family Tust
Purchase Details
Closed on
Jul 29, 1997
Sold by
Donaldson William R and Donaldson Zola G
Bought by
Donaldson William R and Donaldson Zola G
Create a Home Valuation Report for This Property
The Home Valuation Report is an in-depth analysis detailing your home's value as well as a comparison with similar homes in the area
Home Values in the Area
Average Home Value in this Area
Purchase History
| Date | Buyer | Sale Price | Title Company |
|---|---|---|---|
| Cliburn-Ritter Revocable Living Trust | -- | None Listed On Document | |
| Cliburn Scott H | $445,000 | Stewart Title Irvine | |
| Mcnitt Marjorie | -- | None Available | |
| Donaldson William R | -- | -- |
Source: Public Records
Mortgage History
| Date | Status | Borrower | Loan Amount |
|---|---|---|---|
| Previous Owner | Cliburn Scott H | $356,000 |
Source: Public Records
Tax History
| Year | Tax Paid | Tax Assessment Tax Assessment Total Assessment is a certain percentage of the fair market value that is determined by local assessors to be the total taxable value of land and additions on the property. | Land | Improvement |
|---|---|---|---|---|
| 2025 | $6,258 | $573,045 | $458,923 | $114,122 |
| 2024 | $6,258 | $561,809 | $449,924 | $111,885 |
| 2023 | $6,118 | $550,794 | $441,102 | $109,692 |
| 2022 | $5,998 | $539,995 | $432,453 | $107,542 |
| 2021 | $5,830 | $529,407 | $423,973 | $105,434 |
| 2020 | $5,776 | $523,979 | $419,626 | $104,353 |
| 2019 | $5,702 | $513,705 | $411,398 | $102,307 |
| 2018 | $5,614 | $503,633 | $403,332 | $100,301 |
| 2017 | $5,381 | $493,758 | $395,423 | $98,335 |
| 2016 | $5,276 | $484,077 | $387,670 | $96,407 |
| 2015 | $5,198 | $476,806 | $381,847 | $94,959 |
| 2014 | $5,086 | $467,467 | $374,368 | $93,099 |
Source: Public Records
Map
Nearby Homes
- 1201 E Fairway Dr
- 1243 E Almond Ave
- 1314 E Chapman Ave
- 1342 E Chapman Ave
- 700 E Lake Dr Unit 111
- 2726 Concord St
- 178 N Monterey Rd
- 354 E Culver Ave
- 369 S Jennifer Ln
- 2624 N Tustin Ave Unit D (141)
- 2604 N Tustin Ave Unit C
- 255 N Waverly St
- 762 S Breezy Way
- 1514 E Palm Ave
- 2516 N Tustin Ave Unit A
- 2544 Park Lake
- 2624 Forest Lake Unit 13
- 2512 N Tustin Ave Unit D
- 2514 N Tustin Ave Unit 66
- 2528 Park Lake Unit 108
- 1324 E Chalynn Ave
- 1304 E Chalynn Ave
- 1317 E Firwood Ct
- 1311 E Firwood Ct
- 1323 E Firwood Ct Unit 74
- 1303 E Firwood Ct Unit 77
- 1248 E Chalynn Ave
- 1334 E Chalynn Ave
- 1329 E Firwood Ct Unit 73
- 1311 E Chalynn Ave
- 1301 E Chalynn Ave
- 1337 E Firwood Ct
- 1238 E Chalynn Ave
- 1346 E Chalynn Ave
- 1245 E Sunflower Cir
- 521 S Summerfield Way Unit 90
- 520 S Summerfield Way Unit 78
- 1333 E Chalynn Ave
- 1249 E Chalynn Ave
- 1343 E Firwood Ct
Your Personal Tour Guide
Ask me questions while you tour the home.