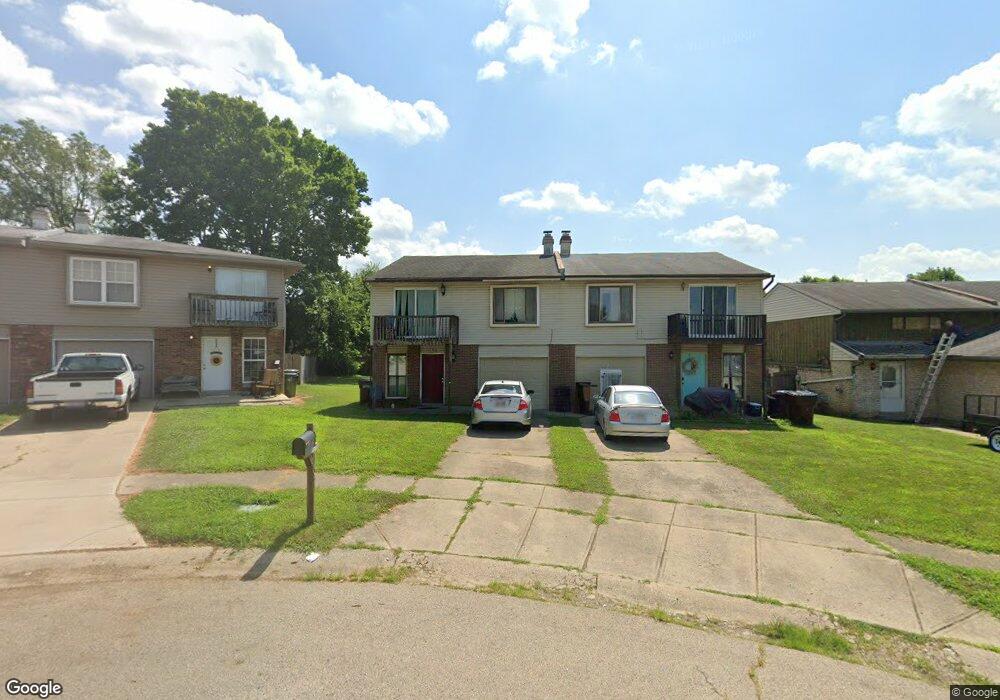
132 Highridge Ct Franklin, OH 45005
Estimated Value: $140,000 - $182,045
2
Beds
2
Baths
1,412
Sq Ft
$117/Sq Ft
Est. Value
About This Home
This home is located at 132 Highridge Ct, Franklin, OH 45005 and is currently estimated at $165,011, approximately $116 per square foot. 132 Highridge Ct is a home located in Warren County with nearby schools including Franklin High School.
Ownership History
Date
Name
Owned For
Owner Type
Purchase Details
Closed on
Jun 18, 2020
Sold by
Combs Kenneth
Bought by
Hamilton Collin M and Hamilton Hannah M
Current Estimated Value
Home Financials for this Owner
Home Financials are based on the most recent Mortgage that was taken out on this home.
Original Mortgage
$78,570
Outstanding Balance
$69,028
Interest Rate
3.2%
Mortgage Type
New Conventional
Estimated Equity
$95,983
Purchase Details
Closed on
Feb 1, 2010
Sold by
Bartlett Kenneth R and Bartlett Kenneth
Bought by
Wells Fargo Bank Na
Purchase Details
Closed on
Dec 23, 2009
Sold by
Wells Fargo Bank Na
Bought by
Secretary Of Housing & Urban Development
Purchase Details
Closed on
Jun 25, 2002
Sold by
Turner Larry
Bought by
Bartlett Kenneth R
Home Financials for this Owner
Home Financials are based on the most recent Mortgage that was taken out on this home.
Original Mortgage
$72,364
Interest Rate
6.87%
Mortgage Type
FHA
Create a Home Valuation Report for This Property
The Home Valuation Report is an in-depth analysis detailing your home's value as well as a comparison with similar homes in the area
Home Values in the Area
Average Home Value in this Area
Purchase History
| Date | Buyer | Sale Price | Title Company |
|---|---|---|---|
| Hamilton Collin M | $81,000 | None Available | |
| Wells Fargo Bank Na | $43,334 | None Available | |
| Secretary Of Housing & Urban Development | -- | None Available | |
| Bartlett Kenneth R | $73,500 | -- |
Source: Public Records
Mortgage History
| Date | Status | Borrower | Loan Amount |
|---|---|---|---|
| Open | Hamilton Collin M | $78,570 | |
| Previous Owner | Bartlett Kenneth R | $72,364 |
Source: Public Records
Tax History
| Year | Tax Paid | Tax Assessment Tax Assessment Total Assessment is a certain percentage of the fair market value that is determined by local assessors to be the total taxable value of land and additions on the property. | Land | Improvement |
|---|---|---|---|---|
| 2025 | $1,963 | $41,800 | $3,500 | $38,300 |
| 2024 | $1,963 | $41,800 | $3,500 | $38,300 |
| 2023 | $1,365 | $26,022 | $3,101 | $22,921 |
| 2022 | $1,339 | $26,023 | $3,101 | $22,922 |
| 2021 | $1,269 | $26,023 | $3,101 | $22,922 |
| 2020 | $1,195 | $21,154 | $2,520 | $18,634 |
| 2019 | $1,089 | $21,154 | $2,520 | $18,634 |
| 2018 | $1,074 | $21,154 | $2,520 | $18,634 |
| 2017 | $1,027 | $18,214 | $2,209 | $16,006 |
| 2016 | $1,047 | $18,214 | $2,209 | $16,006 |
| 2015 | $1,047 | $18,214 | $2,209 | $16,006 |
| 2014 | $1,074 | $18,210 | $2,210 | $16,010 |
| 2013 | $915 | $23,100 | $2,800 | $20,300 |
Source: Public Records
Map
Nearby Homes
- 165 Elaine Dr
- 11 Highridge Ct
- 812 Victoria Dr
- 0 Victoria Dr Unit 942075
- 0 Victoria Dr Unit 1852824
- 21 Skokiaan Dr
- 551 E 2nd St
- 228 Bridge St
- 13 Holly Dr
- 747 David Blvd
- 202 E 2nd St
- 5 S River St
- 760 David Blvd
- 409 Millard Dr
- 45 W 3rd St
- 205 Oxford Rd
- 388 Thomas Dr
- 0 E 4th St
- 1512 Knightsbridge Ct
- 309 Oxford Rd
- 130 Highridge Ct
- 134 Highridge Ct
- 134 Highridge Ct Unit 136
- 128 Highridge Ct
- 136 Highridge Ct
- 126 Highridge Ct
- 138 Highridge Ct
- 124 Highridge Ct
- 122 Highridge Ct
- 140 Highridge Ct
- 222 E Bryant Ave
- 120 Highridge Ct
- 250 E Bryant Ave
- 216 E Bryant Ave
- 118 Highridge Ct
- 129 Highridge Ct
- 127 Highridge Ct
- 131 Highridge Ct
- 125 Highridge Ct
- 133 Highridge Ct
Your Personal Tour Guide
Ask me questions while you tour the home.