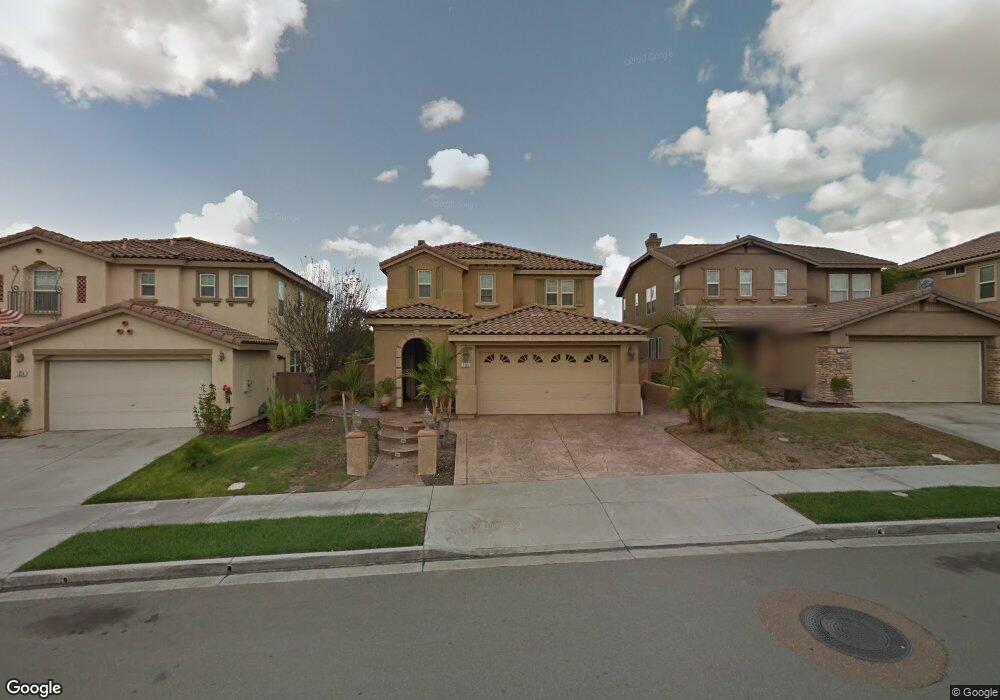
1320 Long View Dr Chula Vista, CA 91915
Eastlake NeighborhoodEstimated Value: $1,097,807 - $1,130,000
5
Beds
3
Baths
2,456
Sq Ft
$452/Sq Ft
Est. Value
About This Home
This home is located at 1320 Long View Dr, Chula Vista, CA 91915 and is currently estimated at $1,109,702, approximately $451 per square foot. 1320 Long View Dr is a home located in San Diego County with nearby schools including Salt Creek Elementary School, Eastlake Middle School, and Eastlake High School.
Ownership History
Date
Name
Owned For
Owner Type
Purchase Details
Closed on
Apr 22, 2009
Sold by
Countrywide Home Loans Servicing Lp
Bought by
Dichoso Nestor B and Dichoso Elisa C
Current Estimated Value
Home Financials for this Owner
Home Financials are based on the most recent Mortgage that was taken out on this home.
Original Mortgage
$425,965
Outstanding Balance
$266,957
Interest Rate
4.78%
Mortgage Type
VA
Estimated Equity
$842,745
Purchase Details
Closed on
Jan 28, 2009
Sold by
Vale Julio and Vale Maria Veronica
Bought by
Countrywide Home Loans Servicing Lp
Purchase Details
Closed on
Apr 22, 2004
Sold by
Kb Home Coastal Inc
Bought by
Vale Julio and Vale Maria Veronica
Home Financials for this Owner
Home Financials are based on the most recent Mortgage that was taken out on this home.
Original Mortgage
$504,000
Interest Rate
4.87%
Mortgage Type
Credit Line Revolving
Create a Home Valuation Report for This Property
The Home Valuation Report is an in-depth analysis detailing your home's value as well as a comparison with similar homes in the area
Home Values in the Area
Average Home Value in this Area
Purchase History
| Date | Buyer | Sale Price | Title Company |
|---|---|---|---|
| Dichoso Nestor B | $417,000 | Landsafe Title | |
| Countrywide Home Loans Servicing Lp | $348,500 | Landsafe Title | |
| Vale Julio | $631,000 | First American Title Co |
Source: Public Records
Mortgage History
| Date | Status | Borrower | Loan Amount |
|---|---|---|---|
| Open | Dichoso Nestor B | $425,965 | |
| Previous Owner | Vale Julio | $504,000 | |
| Closed | Vale Julio | $63,000 |
Source: Public Records
Tax History Compared to Growth
Tax History
| Year | Tax Paid | Tax Assessment Tax Assessment Total Assessment is a certain percentage of the fair market value that is determined by local assessors to be the total taxable value of land and additions on the property. | Land | Improvement |
|---|---|---|---|---|
| 2025 | $8,662 | $536,978 | $206,030 | $330,948 |
| 2024 | $8,662 | $526,450 | $201,991 | $324,459 |
| 2023 | $8,644 | $516,129 | $198,031 | $318,098 |
| 2022 | $8,404 | $506,010 | $194,149 | $311,861 |
| 2021 | $8,232 | $496,090 | $190,343 | $305,747 |
| 2020 | $8,057 | $491,004 | $188,392 | $302,612 |
| 2019 | $7,872 | $481,378 | $184,699 | $296,679 |
| 2018 | $7,759 | $471,940 | $181,078 | $290,862 |
| 2017 | $13 | $462,687 | $177,528 | $285,159 |
| 2016 | $7,360 | $453,616 | $174,048 | $279,568 |
| 2015 | $7,218 | $446,803 | $171,434 | $275,369 |
| 2014 | $7,139 | $438,051 | $168,076 | $269,975 |
Source: Public Records
Map
Nearby Homes
- 2744 Rambling Vista Rd
- 1427 Marble Canyon Way
- 2792 Rambling Vista Rd
- 1277 Granite Springs Dr
- 1328 N Paradise Ridge Way
- 2832 Echo Ridge Ct
- 2814 Rambling Vista Rd
- 2850 Palmetto Point Ct
- 1461 Agate Creek Way
- 1505 Laurel Grove Dr Unit 3
- 2796 Bear Valley Rd
- 2721 Castlehill Rd Unit 1
- 1452 S Creekside Dr
- 2816 Weeping Willow Rd
- 2754 Silver Medal Rd Unit 1
- 2993 Weeping Willow Rd
- 2710 Apricot Ct
- 2710 Sparta Rd Unit 10
- 1515 Crown Ln Unit 6
- 1512 Champion Ln Unit 4
- 1316 Long View Dr
- 1324 Long View Dr
- 1328 Long View Dr
- 1312 Long View Dr
- 1305 Old Janal Ranch Rd
- 1301 Old Janal Ranch Rd
- 1332 Long View Dr
- 1308 Long View Dr
- 1309 Old Janal Ranch Rd
- 1297 Old Janal Ranch Rd
- 1313 Old Janal Ranch Rd
- 1336 Long View Dr
- 1293 Old Janal Ranch Rd
- 1319 Long View Dr
- 1304 Long View Dr
- 1323 Long View Dr
- 1315 Long View Dr
- 1317 Old Janal Ranch Rd
- 1327 Long View Dr
- 1289 Old Janal Ranch Rd