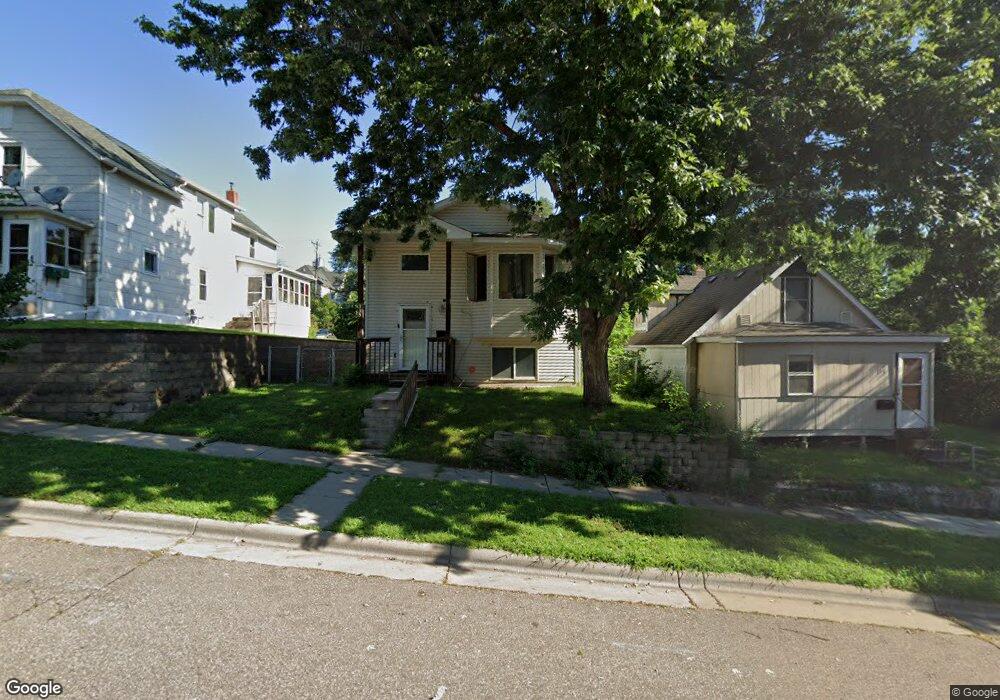
133 Case Ave Saint Paul, MN 55117
North End NeighborhoodEstimated Value: $296,019 - $313,000
4
Beds
2
Baths
946
Sq Ft
$322/Sq Ft
Est. Value
About This Home
This home is located at 133 Case Ave, Saint Paul, MN 55117 and is currently estimated at $304,505, approximately $321 per square foot. 133 Case Ave is a home located in Ramsey County with nearby schools including Bruce F Vento Elementary School, Washington Technology Magnet School, and Creative Arts Secondary School.
Ownership History
Date
Name
Owned For
Owner Type
Purchase Details
Closed on
Jan 28, 2025
Sold by
Myles Lapriese
Bought by
Lsmtr
Current Estimated Value
Purchase Details
Closed on
Jun 14, 2019
Sold by
Ranu Kazi K and Hasan Mirza S
Bought by
Myles Lapriese
Home Financials for this Owner
Home Financials are based on the most recent Mortgage that was taken out on this home.
Original Mortgage
$225,783
Interest Rate
4.1%
Mortgage Type
FHA
Purchase Details
Closed on
Jan 30, 2004
Sold by
James Evik
Bought by
Joe Meyer Homes Inc
Create a Home Valuation Report for This Property
The Home Valuation Report is an in-depth analysis detailing your home's value as well as a comparison with similar homes in the area
Home Values in the Area
Average Home Value in this Area
Purchase History
| Date | Buyer | Sale Price | Title Company |
|---|---|---|---|
| Lsmtr | $500 | None Listed On Document | |
| Myles Lapriese | $230,000 | Results Title | |
| Joe Meyer Homes Inc | $25,400 | -- |
Source: Public Records
Mortgage History
| Date | Status | Borrower | Loan Amount |
|---|---|---|---|
| Previous Owner | Myles Lapriese | $225,783 |
Source: Public Records
Tax History Compared to Growth
Tax History
| Year | Tax Paid | Tax Assessment Tax Assessment Total Assessment is a certain percentage of the fair market value that is determined by local assessors to be the total taxable value of land and additions on the property. | Land | Improvement |
|---|---|---|---|---|
| 2025 | $4,510 | $299,700 | $25,000 | $274,700 |
| 2023 | $4,510 | $290,500 | $20,000 | $270,500 |
| 2022 | $3,662 | $263,100 | $20,000 | $243,100 |
| 2021 | $3,486 | $229,000 | $20,000 | $209,000 |
| 2020 | $2,940 | $226,300 | $10,200 | $216,100 |
| 2019 | $3,750 | $181,900 | $10,200 | $171,700 |
| 2018 | $2,906 | $189,100 | $10,200 | $178,900 |
| 2017 | $2,852 | $154,400 | $10,200 | $144,200 |
| 2016 | $2,636 | $0 | $0 | $0 |
| 2015 | $1,924 | $129,400 | $10,200 | $119,200 |
| 2014 | $1,932 | $0 | $0 | $0 |
Source: Public Records
Map
Nearby Homes