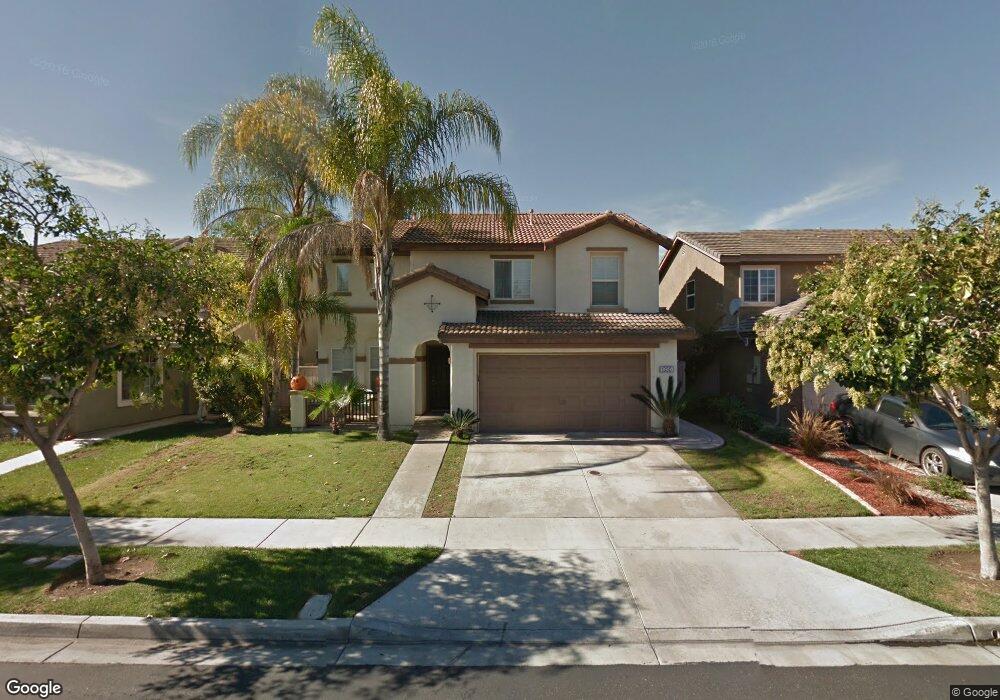
1330 Montera St Chula Vista, CA 91913
Otay Ranch Village NeighborhoodEstimated Value: $902,572 - $962,000
4
Beds
3
Baths
2,001
Sq Ft
$466/Sq Ft
Est. Value
About This Home
This home is located at 1330 Montera St, Chula Vista, CA 91913 and is currently estimated at $933,393, approximately $466 per square foot. 1330 Montera St is a home located in San Diego County with nearby schools including Anne & William Hedenkamp Elementary School, Rancho Del Rey Middle School, and Otay Ranch Senior High School.
Ownership History
Date
Name
Owned For
Owner Type
Purchase Details
Closed on
May 12, 2010
Sold by
Edillor Moises A and Edillor Minerva B
Bought by
Yates William and Yates Lisa
Current Estimated Value
Home Financials for this Owner
Home Financials are based on the most recent Mortgage that was taken out on this home.
Original Mortgage
$363,298
Outstanding Balance
$243,266
Interest Rate
5.03%
Mortgage Type
FHA
Estimated Equity
$690,127
Purchase Details
Closed on
Jul 22, 2005
Sold by
Yoon Dongjun and Yoon Seonok
Bought by
Edillor Moises A and Edillor Minerva B
Home Financials for this Owner
Home Financials are based on the most recent Mortgage that was taken out on this home.
Original Mortgage
$496,000
Interest Rate
5.87%
Mortgage Type
Fannie Mae Freddie Mac
Purchase Details
Closed on
Aug 6, 2001
Sold by
Standard Pacific Corp
Bought by
Yoon Dongjun and Yoon Seonok
Home Financials for this Owner
Home Financials are based on the most recent Mortgage that was taken out on this home.
Original Mortgage
$233,700
Interest Rate
7.37%
Create a Home Valuation Report for This Property
The Home Valuation Report is an in-depth analysis detailing your home's value as well as a comparison with similar homes in the area
Home Values in the Area
Average Home Value in this Area
Purchase History
| Date | Buyer | Sale Price | Title Company |
|---|---|---|---|
| Yates William | $370,000 | Lawyers Title Company | |
| Edillor Moises A | $620,000 | Equity Title Company | |
| Yoon Dongjun | $292,500 | Chicago Title |
Source: Public Records
Mortgage History
| Date | Status | Borrower | Loan Amount |
|---|---|---|---|
| Open | Yates William | $363,298 | |
| Previous Owner | Edillor Moises A | $496,000 | |
| Previous Owner | Yoon Dongjun | $233,700 |
Source: Public Records
Tax History
| Year | Tax Paid | Tax Assessment Tax Assessment Total Assessment is a certain percentage of the fair market value that is determined by local assessors to be the total taxable value of land and additions on the property. | Land | Improvement |
|---|---|---|---|---|
| 2025 | $8,468 | $477,586 | $206,524 | $271,062 |
| 2024 | $8,468 | $468,223 | $202,475 | $265,748 |
| 2023 | $8,326 | $459,043 | $198,505 | $260,538 |
| 2022 | $8,101 | $450,043 | $194,613 | $255,430 |
| 2021 | $7,942 | $441,220 | $190,798 | $250,422 |
| 2020 | $7,771 | $436,697 | $188,842 | $247,855 |
| 2019 | $7,591 | $428,136 | $185,140 | $242,996 |
| 2018 | $7,467 | $419,742 | $181,510 | $238,232 |
| 2017 | $7,333 | $411,512 | $177,951 | $233,561 |
| 2016 | $7,091 | $403,444 | $174,462 | $228,982 |
| 2015 | $6,926 | $397,385 | $171,842 | $225,543 |
| 2014 | $6,899 | $389,601 | $168,476 | $221,125 |
Source: Public Records
Map
Nearby Homes
- 1405 Carneros Valley St
- 1156 Tristan River Rd
- 1457 Fieldbrook St
- 1461 Fieldbrook St
- 1286 Wheatland St
- 1512 Donze Ave
- 1441 Santa Lucia Rd Unit 615
- 1532 Painted Cave Ave
- 1508 Carpinteria St
- 1345 Santa Diana Rd
- 1395 Santa Diana Rd Unit 3
- 1481 Pershing Rd
- 1004 Red Granite Rd
- 1514 Pershing Rd
- 1498 Pershing Rd
- 1506 Pershing Rd
- 1510 Pershing Rd
- 1502 Pershing Rd
- 1339 Mesa Grande Place
- 1485 Pershing Rd
- 1326 Montera St
- 1334 Montera St
- 1322 Montera St
- 1338 Montera St
- 1321 Carneros Valley St
- 1325 Carneros Valley St
- 1317 Carneros Valley St
- 1329 Carneros Valley St
- 1331 Montera St
- 1342 Montera St
- 1318 Montera St
- 1327 Montera St
- 1335 Montera St
- 1323 Montera St Unit 1
- 1313 Carneros Valley St
- 1339 Montera St
- 1333 Carneros Valley St
- 1346 Montera St
- 1319 Montera St
- 1343 Montera St
Your Personal Tour Guide
Ask me questions while you tour the home.