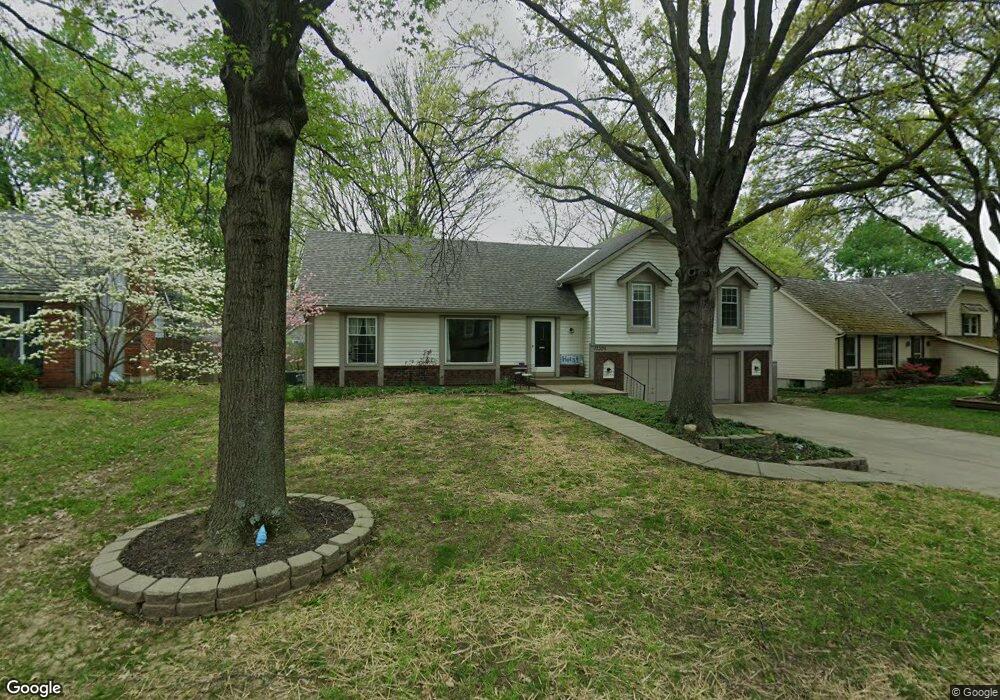
13305 W 77th Terrace Shawnee, KS 66216
Estimated Value: $403,032 - $436,000
4
Beds
3
Baths
2,000
Sq Ft
$211/Sq Ft
Est. Value
About This Home
This home is located at 13305 W 77th Terrace, Shawnee, KS 66216 and is currently estimated at $421,008, approximately $210 per square foot. 13305 W 77th Terrace is a home located in Johnson County with nearby schools including Mill Creek Elementary School, Trailridge Middle School, and Shawnee Mission Northwest High School.
Ownership History
Date
Name
Owned For
Owner Type
Purchase Details
Closed on
Nov 7, 2012
Sold by
Secretary Of Hud
Bought by
Holst Paul D and Holst Shawnasea S
Current Estimated Value
Home Financials for this Owner
Home Financials are based on the most recent Mortgage that was taken out on this home.
Original Mortgage
$62,500
Outstanding Balance
$43,209
Interest Rate
3.4%
Mortgage Type
Stand Alone Second
Estimated Equity
$377,799
Purchase Details
Closed on
May 3, 2012
Sold by
Larkins Cindy Lee and Gore Jearnine
Bought by
The Secretary Of Housing & Urban Develop
Purchase Details
Closed on
Apr 22, 2008
Sold by
Larkins Cindy Lee
Bought by
Larkins Cindy Lee
Purchase Details
Closed on
Nov 12, 2003
Sold by
Pine Scott Joseph
Bought by
Larkins Cindy Lee
Create a Home Valuation Report for This Property
The Home Valuation Report is an in-depth analysis detailing your home's value as well as a comparison with similar homes in the area
Home Values in the Area
Average Home Value in this Area
Purchase History
| Date | Buyer | Sale Price | Title Company |
|---|---|---|---|
| Holst Paul D | -- | None Available | |
| The Secretary Of Housing & Urban Develop | $222,299 | Continental Title | |
| Larkins Cindy Lee | -- | First United Title Agency | |
| Larkins Cindy Lee | -- | -- |
Source: Public Records
Mortgage History
| Date | Status | Borrower | Loan Amount |
|---|---|---|---|
| Open | Holst Paul D | $62,500 | |
| Open | Holst Paul D | $92,658 |
Source: Public Records
Tax History Compared to Growth
Tax History
| Year | Tax Paid | Tax Assessment Tax Assessment Total Assessment is a certain percentage of the fair market value that is determined by local assessors to be the total taxable value of land and additions on the property. | Land | Improvement |
|---|---|---|---|---|
| 2024 | $4,533 | $41,021 | $7,878 | $33,143 |
| 2023 | $4,317 | $38,341 | $7,504 | $30,837 |
| 2022 | $4,047 | $35,903 | $6,822 | $29,081 |
| 2021 | $3,765 | $31,659 | $6,203 | $25,456 |
| 2020 | $3,678 | $30,613 | $6,203 | $24,410 |
| 2019 | $3,386 | $28,141 | $5,173 | $22,968 |
| 2018 | $3,478 | $28,670 | $5,173 | $23,497 |
| 2017 | $3,230 | $25,783 | $4,698 | $21,085 |
| 2016 | $3,139 | $24,737 | $4,520 | $20,217 |
| 2015 | $2,945 | $23,346 | $4,520 | $18,826 |
| 2013 | -- | $21,126 | $4,520 | $16,606 |
Source: Public Records
Map
Nearby Homes
- 7514 Caenen Lake Rd
- 8011 Gillette St
- 13716 W 75th Terrace
- 7736 Westgate Dr
- 7904 Rosehill Rd
- 13800 W 75th Ct
- 7917 Westgate Dr
- 7805 Long Ave
- 7812 Caenen St
- 7526 Monrovia St
- 12212 W 79th Terrace
- 13100 W 72nd St
- 7115 Richards Dr
- 7105 Richards Dr
- 7913 Colony Ln
- 12403 W 72nd Terrace
- Augusta Plan at Kenneth Estates
- Newport Plan at Kenneth Estates
- Rosemount II Plan at Kenneth Estates
- The Avala Villa Plan at Kenneth Estates
- 13309 W 77th Terrace
- 13227 W 77th Terrace
- 13402 W 77th Place
- 13318 W 77th Place
- 13325 W 77th Terrace
- 13223 W 77th Terrace
- 13304 W 77th Terrace
- 13408 W 77th Place
- 13310 W 77th Place
- 13316 W 77th Terrace
- 13329 W 77th Terrace
- 13214 W 77th Terrace
- 13215 W 77th Terrace
- 13306 W 77th Place
- 13221 W 76th St
- 13410 W 77th Place
- 13218 W 77th St
- 13321 W 77th Place
- 13401 W 77th Terrace
- 13411 W 77th Place