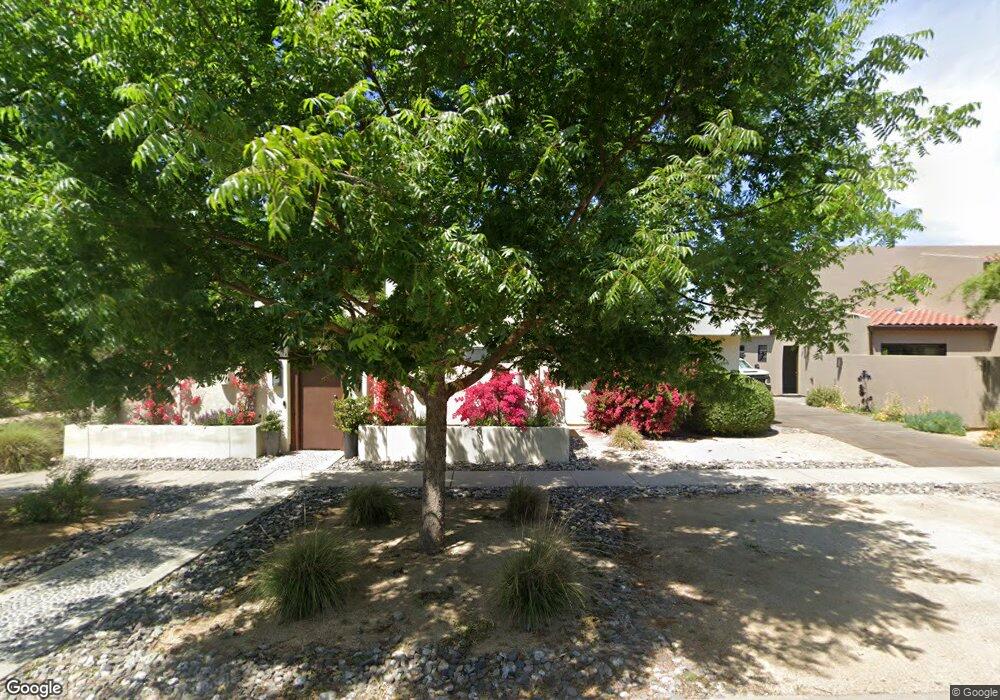
1341 Cassel Ln Davis, CA 95616
North Davis NeighborhoodEstimated Value: $1,245,000 - $1,728,000
4
Beds
3
Baths
3,000
Sq Ft
$467/Sq Ft
Est. Value
About This Home
This home is located at 1341 Cassel Ln, Davis, CA 95616 and is currently estimated at $1,402,171, approximately $467 per square foot. 1341 Cassel Ln is a home located in Yolo County with nearby schools including North Davis Elementary School, Oliver Wendell Holmes Junior High School, and Davis Senior High School.
Ownership History
Date
Name
Owned For
Owner Type
Purchase Details
Closed on
Mar 31, 2021
Sold by
Lewin Harris A
Bought by
Harris A Lewin Trust and Lewin
Current Estimated Value
Purchase Details
Closed on
Mar 30, 2021
Sold by
Olweira Rosane Pereira De
Bought by
Lewin Harris A
Purchase Details
Closed on
Aug 15, 2011
Sold by
Whitcombe Sandy M
Bought by
Pereira Lewin Harris A and Pereira De Oliveira Rosane
Home Financials for this Owner
Home Financials are based on the most recent Mortgage that was taken out on this home.
Original Mortgage
$600,000
Interest Rate
4.53%
Mortgage Type
Purchase Money Mortgage
Purchase Details
Closed on
Nov 1, 2007
Sold by
Fisher David Stevenson
Bought by
Whitcombe Sandy M
Purchase Details
Closed on
May 12, 2006
Sold by
North Davis Farms/Cassel Llc
Bought by
Whitcombe Sandy
Create a Home Valuation Report for This Property
The Home Valuation Report is an in-depth analysis detailing your home's value as well as a comparison with similar homes in the area
Home Values in the Area
Average Home Value in this Area
Purchase History
| Date | Buyer | Sale Price | Title Company |
|---|---|---|---|
| Harris A Lewin Trust | -- | None Listed On Document | |
| Lewin Harris A | -- | None Listed On Document | |
| Lewin Harris A | -- | None Available | |
| Pereira Lewin Harris A | $975,000 | Placer Title Company | |
| Whitcombe Sandy M | -- | Fidelity Natl Title Co Of Ca | |
| Whitcombe Sandy M | $396,000 | Fidelity Natl Title Co Of Ca | |
| Whitcombe Sandy | $420,000 | Old Republic Title Company |
Source: Public Records
Mortgage History
| Date | Status | Borrower | Loan Amount |
|---|---|---|---|
| Previous Owner | Pereira Lewin Harris A | $600,000 |
Source: Public Records
Tax History
| Year | Tax Paid | Tax Assessment Tax Assessment Total Assessment is a certain percentage of the fair market value that is determined by local assessors to be the total taxable value of land and additions on the property. | Land | Improvement |
|---|---|---|---|---|
| 2025 | $14,817 | $1,235,782 | $508,237 | $727,545 |
| 2023 | $14,817 | $1,187,797 | $488,502 | $699,295 |
| 2022 | $14,245 | $1,164,508 | $478,924 | $685,584 |
| 2021 | $13,854 | $1,131,384 | $464,158 | $667,226 |
| 2020 | $13,692 | $1,119,784 | $459,399 | $660,385 |
| 2019 | $13,265 | $1,097,829 | $450,392 | $647,437 |
| 2018 | $12,336 | $1,076,304 | $441,561 | $634,743 |
| 2017 | $12,112 | $1,055,201 | $432,903 | $622,298 |
| 2016 | $11,866 | $1,034,512 | $424,415 | $610,097 |
| 2015 | $11,473 | $1,018,973 | $418,040 | $600,933 |
| 2014 | $11,473 | $999,014 | $409,852 | $589,162 |
Source: Public Records
Map
Nearby Homes
- 3117 Northfield Ct
- 824 Harrier Place
- 1330 Antelope Ave Unit 27
- 813 Barcelona Ave
- 771 Bianco Ct
- 529 Flicker Ave
- 2818 Anza Ave
- 5709 Thomson Loop
- 1838 Foster Ln
- 1815 Foster Ln
- 1814 Foster Ln
- 1577 Drake Dr
- 1932 Chasen Ln
- 3303 Houser Ct
- 1560 Drake Dr
- 3360 Houser Ct
- 3368 Houser Ct
- 1651 Joshua Tree St
- 1427 Brown Dr
- 404 Cabrillo Ave
- 1335 Cassel Ln
- 1347 Cassel Ln
- 1353 Cassel Ln
- 1329 Cassel Ln
- 1359 Cassel Ln
- 1322 N Davis Farms Rd
- 1323 Cassel Ln
- 1371 Cassel Ln
- 1316 N Davis Farms Rd
- 1330 N Davis Farms Rd
- 1365 Cassel Ln
- 1324 Cassel Ln
- 1317 Cassel Ln
- 1383 Cassel Ln
- 1318 Cassel Ln
- 1377 Cassel Ln
- 3057 Cassel Place
- 1310 N Davis Farms Rd
- 1338 N Davis Farms Rd
- 1389 Cassel Ln
Your Personal Tour Guide
Ask me questions while you tour the home.