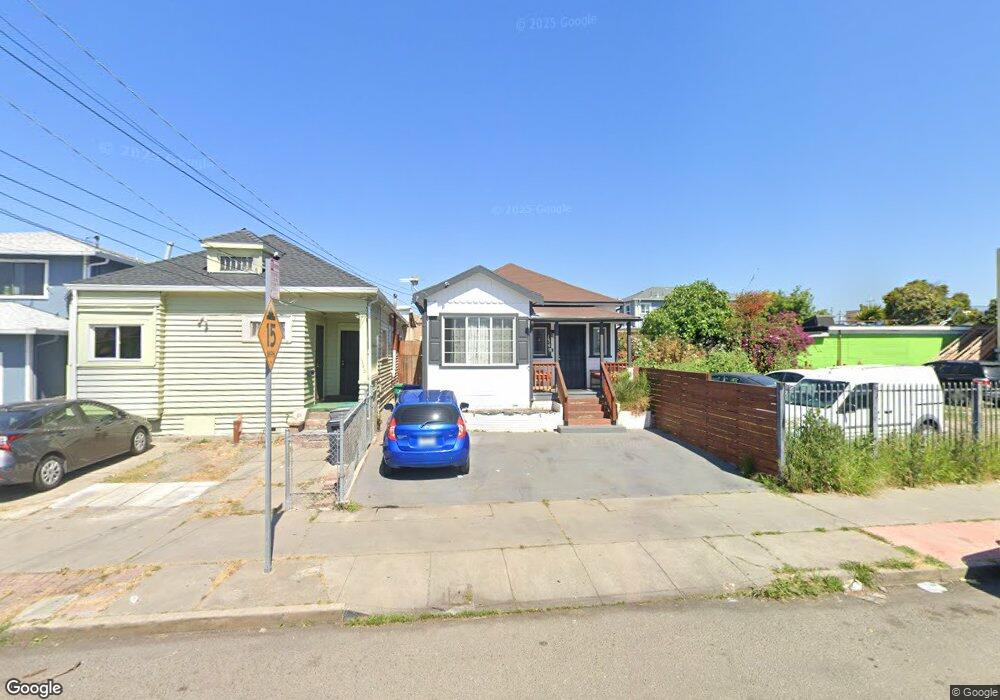
1349 53rd Ave Oakland, CA 94601
Melrose NeighborhoodEstimated Value: $399,325 - $571,000
3
Beds
1
Bath
730
Sq Ft
$655/Sq Ft
Est. Value
About This Home
This home is located at 1349 53rd Ave, Oakland, CA 94601 and is currently estimated at $478,331, approximately $655 per square foot. 1349 53rd Ave is a home located in Alameda County with nearby schools including Bridges Academy Elementary School, Greenleaf TK-8, and Coliseum College Prep Academy.
Ownership History
Date
Name
Owned For
Owner Type
Purchase Details
Closed on
Mar 31, 2005
Sold by
Nieves Juan Carlos
Bought by
Nieves Juan Carlos and Nieves Patricia
Current Estimated Value
Purchase Details
Closed on
Nov 14, 2002
Sold by
Nieves Patricia
Bought by
Nieves Juan Carlos
Home Financials for this Owner
Home Financials are based on the most recent Mortgage that was taken out on this home.
Original Mortgage
$190,000
Outstanding Balance
$75,768
Interest Rate
5.37%
Estimated Equity
$402,563
Purchase Details
Closed on
Jul 24, 2001
Sold by
Collins Araceli
Bought by
Arroyo Bulmaro G
Home Financials for this Owner
Home Financials are based on the most recent Mortgage that was taken out on this home.
Original Mortgage
$174,600
Interest Rate
7.15%
Purchase Details
Closed on
Apr 11, 2001
Sold by
Gooch Eugenia D
Bought by
Surety Funding Inc
Home Financials for this Owner
Home Financials are based on the most recent Mortgage that was taken out on this home.
Original Mortgage
$66,000
Interest Rate
7.09%
Purchase Details
Closed on
May 3, 1999
Sold by
Diversified Unlimited Inc
Bought by
Gooch Eugenia D
Purchase Details
Closed on
Dec 4, 1998
Sold by
Bradley Jerri L
Bought by
Diversified Unlimited Inc
Create a Home Valuation Report for This Property
The Home Valuation Report is an in-depth analysis detailing your home's value as well as a comparison with similar homes in the area
Home Values in the Area
Average Home Value in this Area
Purchase History
| Date | Buyer | Sale Price | Title Company |
|---|---|---|---|
| Nieves Juan Carlos | -- | -- | |
| Nieves Juan Carlos | -- | Old Republic Title Co | |
| Nieves Juan Carlos | $63,500 | Old Republic Title Co | |
| Arroyo Bulmaro G | -- | Placer Title Company | |
| Nieves Juan Carlos | $180,000 | Placer Title Company | |
| Surety Funding Inc | $79,000 | New Century Title Company | |
| Gooch Eugenia D | -- | -- | |
| Diversified Unlimited Inc | $57,000 | -- |
Source: Public Records
Mortgage History
| Date | Status | Borrower | Loan Amount |
|---|---|---|---|
| Open | Nieves Juan Carlos | $190,000 | |
| Previous Owner | Nieves Juan Carlos | $174,600 | |
| Previous Owner | Surety Funding Inc | $66,000 |
Source: Public Records
Tax History Compared to Growth
Tax History
| Year | Tax Paid | Tax Assessment Tax Assessment Total Assessment is a certain percentage of the fair market value that is determined by local assessors to be the total taxable value of land and additions on the property. | Land | Improvement |
|---|---|---|---|---|
| 2025 | $5,046 | $258,895 | $79,768 | $186,127 |
| 2024 | $5,046 | $253,682 | $78,204 | $182,478 |
| 2023 | $5,209 | $255,572 | $76,671 | $178,901 |
| 2022 | $5,022 | $243,561 | $75,168 | $175,393 |
| 2021 | $4,695 | $238,648 | $73,694 | $171,954 |
| 2020 | $4,642 | $243,130 | $72,939 | $170,191 |
| 2019 | $4,400 | $238,364 | $71,509 | $166,855 |
| 2018 | $4,310 | $233,691 | $70,107 | $163,584 |
| 2017 | $4,120 | $229,110 | $68,733 | $160,377 |
| 2016 | $3,920 | $224,620 | $67,386 | $157,234 |
| 2015 | $3,895 | $221,246 | $66,374 | $154,872 |
| 2014 | $3,405 | $185,000 | $55,500 | $129,500 |
Source: Public Records
Map
Nearby Homes
- 1436 52nd Ave
- 1433 50th Ave
- 1024 50th Ave
- 1507 48th Ave
- 1434 47th Ave
- 5217 Bancroft Ave
- 5483 Wadean Place
- 1620 46th Ave
- 4709 Foothill Blvd
- 1424 57th Ave
- 1830 Vicksburg Ave
- 1430 45th Ave
- 1244 58th Ave
- 5540 E 17th St
- 5421 Wentworth Ave
- 1605 57th Ave
- 5715 E 16th St
- 1604 57th Ave
- 2100 51st Ave
- 1109 Seminary Ave
- 1345 53rd Ave
- 1341 53rd Ave
- 1395 53rd Ave
- 5213 International Blvd
- 1337 53rd Ave
- 1368 52nd Ave
- 1364 52nd Ave
- 5301 International Blvd
- 1374 52nd Ave
- 1354 53rd Ave
- 1350 53rd Ave
- 5307 International Blvd
- 1346 53rd Ave
- 1336 53rd Ave
- 1340 53rd Ave
- 1332 53rd Ave
- 5311 International Blvd
- 1328 53rd Ave
- 5133 International Blvd
- 1320 53rd Ave