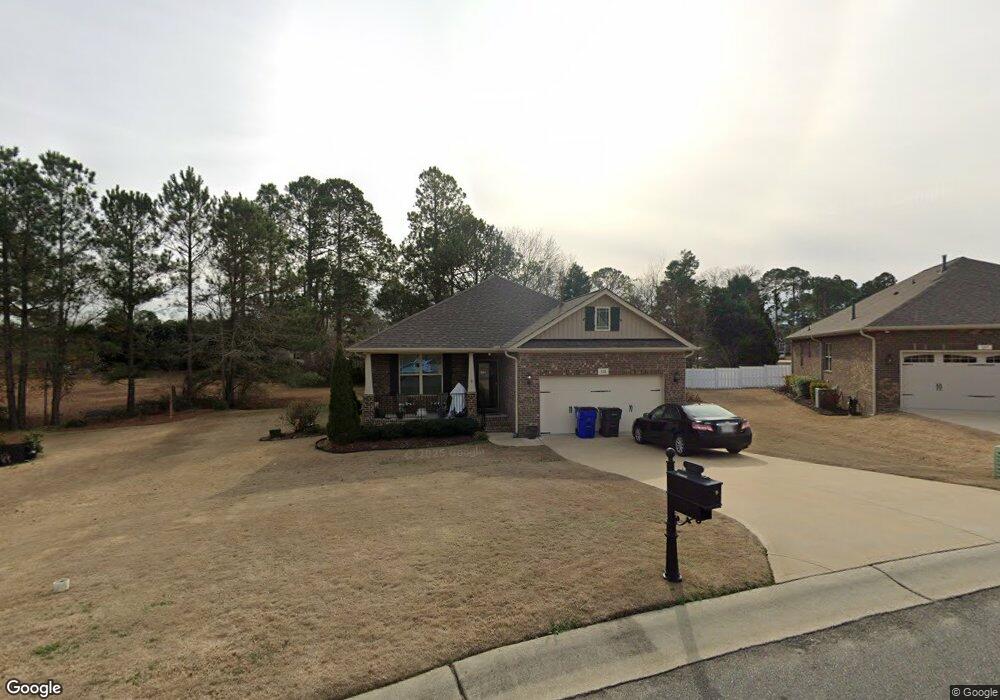
135 Colonade Ct Unit 18 Benson, NC 27504
Estimated Value: $334,000 - $373,000
4
Beds
2
Baths
1,961
Sq Ft
$181/Sq Ft
Est. Value
About This Home
This home is located at 135 Colonade Ct Unit 18, Benson, NC 27504 and is currently estimated at $355,013, approximately $181 per square foot. 135 Colonade Ct Unit 18 is a home located in Johnston County with nearby schools including Benson Elementary School, Benson Middle School, and South Johnston High School.
Ownership History
Date
Name
Owned For
Owner Type
Purchase Details
Closed on
Feb 10, 2017
Sold by
Adams Homes Aec Llc
Bought by
Upson Kelley Mary Elizabeth
Current Estimated Value
Home Financials for this Owner
Home Financials are based on the most recent Mortgage that was taken out on this home.
Original Mortgage
$188,955
Outstanding Balance
$156,447
Interest Rate
4.2%
Mortgage Type
New Conventional
Estimated Equity
$198,566
Purchase Details
Closed on
Jun 6, 2016
Sold by
Brick Castle Holdings Llc
Bought by
Adams Homes Aec Llc
Home Financials for this Owner
Home Financials are based on the most recent Mortgage that was taken out on this home.
Original Mortgage
$167,960
Interest Rate
3.66%
Mortgage Type
Construction
Purchase Details
Closed on
Dec 15, 2009
Sold by
Fmd Inc
Bought by
Brick Castle Holdings Llc
Create a Home Valuation Report for This Property
The Home Valuation Report is an in-depth analysis detailing your home's value as well as a comparison with similar homes in the area
Home Values in the Area
Average Home Value in this Area
Purchase History
We collect this data history from publicly available records. To have your information removed, we recommend requesting removal directly through your county’s website.
| Date | Buyer | Sale Price | Title Company |
|---|---|---|---|
| Upson Kelley Mary Elizabeth | $210,000 | -- | |
| Adams Homes Aec Llc | $21,000 | None Available | |
| Brick Castle Holdings Llc | $250,000 | None Available |
Source: Public Records
Mortgage History
We collect this data history from publicly available records. To have your information removed, we recommend requesting removal directly through your county’s website.
| Date | Status | Borrower | Loan Amount |
|---|---|---|---|
| Open | Upson Kelley Mary Elizabeth | $188,955 | |
| Previous Owner | Adams Homes Aec Llc | $167,960 |
Source: Public Records
Tax History
| Year | Tax Paid | Tax Assessment Tax Assessment Total Assessment is a certain percentage of the fair market value that is determined by local assessors to be the total taxable value of land and additions on the property. | Land | Improvement |
|---|---|---|---|---|
| 2025 | $4,139 | $366,320 | $50,000 | $316,320 |
| 2024 | $2,961 | $231,320 | $25,000 | $206,320 |
| 2023 | $2,961 | $231,320 | $25,000 | $206,320 |
| 2022 | $2,961 | $231,320 | $25,000 | $206,320 |
| 2021 | $2,961 | $231,320 | $25,000 | $206,320 |
| 2020 | $2,984 | $231,320 | $25,000 | $206,320 |
| 2019 | $2,984 | $231,320 | $25,000 | $206,320 |
| 2018 | $2,804 | $212,400 | $39,500 | $172,900 |
| 2017 | $1,340 | $101,500 | $39,500 | $62,000 |
| 2016 | $517 | $39,500 | $39,500 | $0 |
| 2015 | $517 | $39,500 | $39,500 | $0 |
| 2014 | $517 | $39,500 | $39,500 | $0 |
Source: Public Records
Map
Nearby Homes
- 303 N Lincoln St
- 401 N Lincoln St
- 117 Boomer St
- 702 W Main St
- 212 W Church St
- 316 W Parrish Dr
- 804 W Main St
- 204 W Hill St
- 302 S Pine St
- 310 Pierre Dr
- 323 W Woodall St
- 206 S Wall St
- 401 W Brocklyn St
- Tract 3 Benson Hardee Rd
- Tract 1 Benson Hardee Rd
- Tract 2 Benson Hardee Rd
- 520 S Lincoln St
- 19 Atlantic Ave
- 421 Plentiful Way Unit 111
- 107 Oak Park Dr
- 135 Colonade Ct
- 137 Colonade Ct
- 137 Colonade Ct Unit Lot 19
- 133 Colonade Ct
- 133 Colonade Ct Unit Lot 17
- 139 Colonade Ct Unit Lot 20
- 139 Colonade Ct
- 132 Colonade Ct Unit 36
- 132 Colonade Ct
- 404 W Martin St
- 131 Colonade Ct Unit 16
- 131 Colonade Ct
- 412 W Martin St
- 141 Colonade Ct
- 141 Colonade Ct Unit Lot 21
- 130 Colonade Ct
- 130 Colonade Ct Unit 35
- 140 Colonade Ct
- 140 Colonade Ct Unit 19
- 140 Colonade Ct Unit Lot 37
Your Personal Tour Guide
Ask me questions while you tour the home.