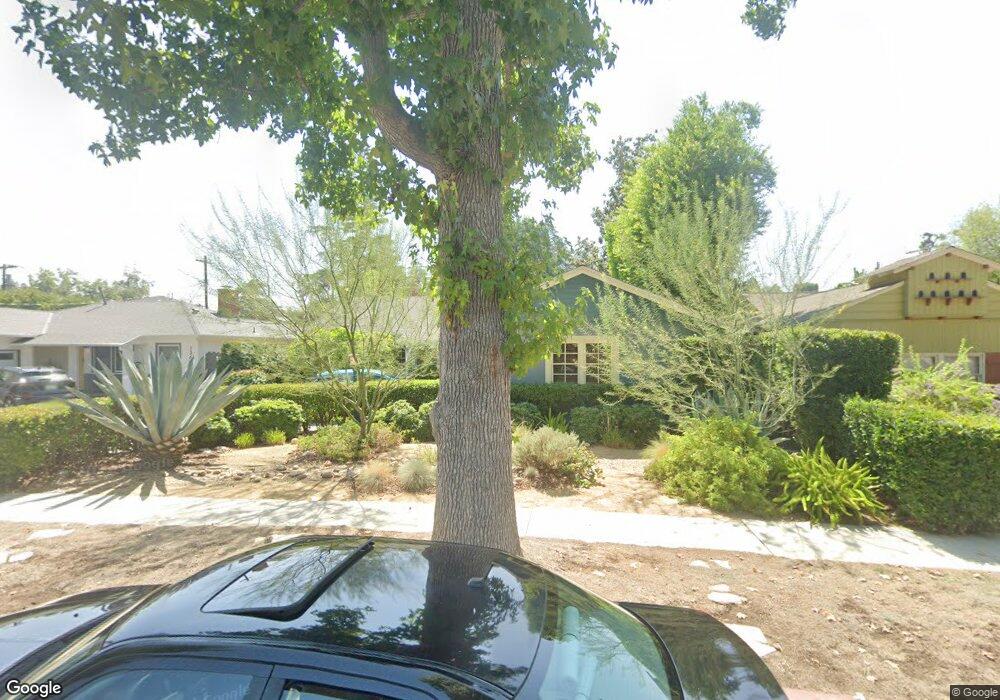
13612 Debby St van Nuys, CA 91401
Estimated Value: $962,158 - $1,130,000
3
Beds
2
Baths
1,398
Sq Ft
$760/Sq Ft
Est. Value
About This Home
This home is located at 13612 Debby St, van Nuys, CA 91401 and is currently estimated at $1,061,790, approximately $759 per square foot. 13612 Debby St is a home located in Los Angeles County with nearby schools including Erwin Street Elementary School, Ulysses S. Grant Senior High School, and Ararat Charter School.
Ownership History
Date
Name
Owned For
Owner Type
Purchase Details
Closed on
Sep 14, 2016
Sold by
Turner Kathi Ann
Bought by
Turley Margaret M and Turner Kathi A
Current Estimated Value
Purchase Details
Closed on
Nov 14, 2012
Sold by
Turner Kathi Ann and Turley Margaret M
Bought by
Turner Kathi Ann and Turley Margaret M
Home Financials for this Owner
Home Financials are based on the most recent Mortgage that was taken out on this home.
Original Mortgage
$228,500
Outstanding Balance
$40,444
Interest Rate
3.33%
Mortgage Type
New Conventional
Estimated Equity
$1,021,346
Purchase Details
Closed on
Apr 21, 2003
Sold by
Vallely Tannis K
Bought by
Turner Kathi Ann
Home Financials for this Owner
Home Financials are based on the most recent Mortgage that was taken out on this home.
Original Mortgage
$270,000
Interest Rate
5.61%
Mortgage Type
Purchase Money Mortgage
Purchase Details
Closed on
May 2, 1995
Sold by
Turner Kathi Ann and Turley Margaret M
Bought by
Turner Kathi Ann and Turley Margaret M
Create a Home Valuation Report for This Property
The Home Valuation Report is an in-depth analysis detailing your home's value as well as a comparison with similar homes in the area
Home Values in the Area
Average Home Value in this Area
Purchase History
| Date | Buyer | Sale Price | Title Company |
|---|---|---|---|
| Turley Margaret M | -- | None Available | |
| Turner Kathi Ann | -- | Lsi | |
| Turner Kathi Ann | -- | California Title Company | |
| Turner Kathi Ann | -- | First American Title |
Source: Public Records
Mortgage History
| Date | Status | Borrower | Loan Amount |
|---|---|---|---|
| Open | Turner Kathi Ann | $228,500 | |
| Previous Owner | Turner Kathi Ann | $270,000 |
Source: Public Records
Tax History
| Year | Tax Paid | Tax Assessment Tax Assessment Total Assessment is a certain percentage of the fair market value that is determined by local assessors to be the total taxable value of land and additions on the property. | Land | Improvement |
|---|---|---|---|---|
| 2025 | $4,330 | $354,072 | $124,399 | $229,673 |
| 2024 | $4,330 | $347,130 | $121,960 | $225,170 |
| 2023 | $4,247 | $340,324 | $119,569 | $220,755 |
| 2022 | $4,051 | $333,652 | $117,225 | $216,427 |
| 2021 | $3,995 | $327,111 | $114,927 | $212,184 |
| 2019 | $3,875 | $317,411 | $111,519 | $205,892 |
| 2018 | $3,806 | $311,188 | $109,333 | $201,855 |
| 2016 | $3,625 | $299,107 | $105,089 | $194,018 |
| 2015 | $3,571 | $294,615 | $103,511 | $191,104 |
| 2014 | $3,589 | $288,845 | $101,484 | $187,361 |
Source: Public Records
Map
Nearby Homes
- 13600 Sylvan St
- 13633 Delano St
- 13522 Delano St
- 6044 Woodman Ave
- 13452 Delano St
- 6038 Allott Ave
- 13744 Bessemer St
- 13413 Friar St
- 13430 Victory Blvd
- 13816 Bessemer St
- 13831 Bessemer St
- 13350 Victory Blvd
- 6026 Greenbush Ave
- 13847 Gilmore St
- 5923 Woodman Ave
- 13430 Oxnard St
- 13822 Oxnard St
- 6250 Fulton Ave Unit 205
- 13405 Tiara St
- 14005 Victory Blvd
- 13606 Debby St
- 13618 Debby St
- 13602 Debby St
- 13600 Debby St
- 6211 Ventura Canyon Ave
- 13624 Debby St
- 13615 Erwin St
- 13625 Erwin St
- 13615 Debby St
- 13609 Debby St
- 13607 Erwin St
- 13621 Debby St
- 13629 Erwin St
- 13641 Erwin St
- 13603 Debby St
- 6225 Buffalo Ave
- 13643 Erwin St
- 6240 Buffalo Ave
- 6243 Ventura Canyon Ave
- 6227 Buffalo Ave
Your Personal Tour Guide
Ask me questions while you tour the home.