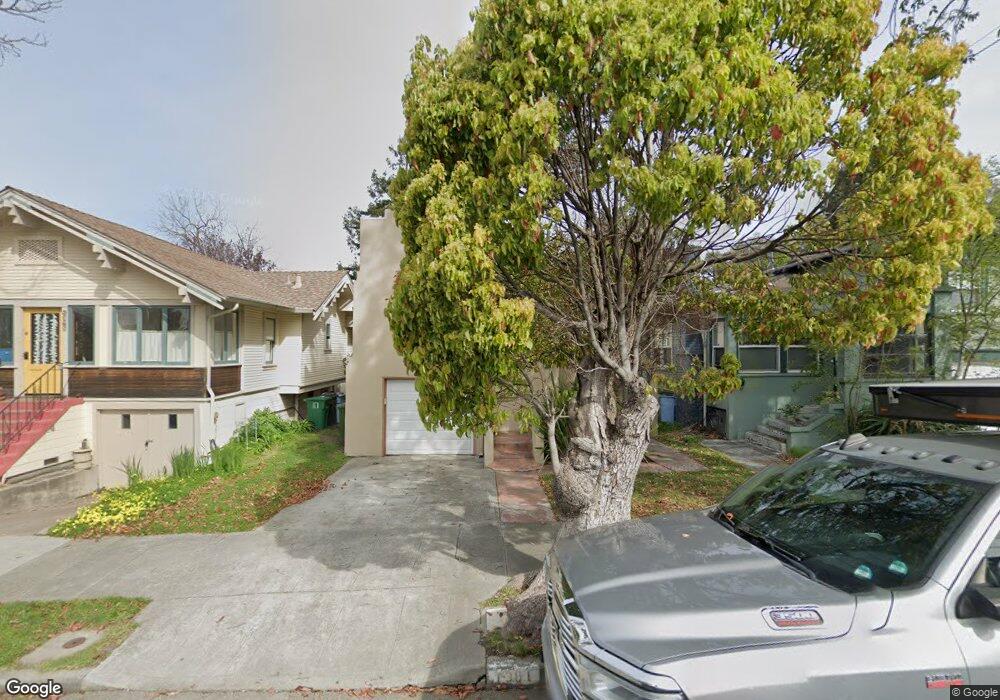
1381 Hearst Ave Berkeley, CA 94702
West Berkeley NeighborhoodEstimated Value: $1,102,000 - $1,640,000
3
Beds
1
Bath
988
Sq Ft
$1,260/Sq Ft
Est. Value
About This Home
This home is located at 1381 Hearst Ave, Berkeley, CA 94702 and is currently estimated at $1,244,401, approximately $1,259 per square foot. 1381 Hearst Ave is a home located in Alameda County with nearby schools including Ruth Acty Elementary, Rosa Parks Elementary School, and Berkeley Arts Magnet at Whittier School.
Ownership History
Date
Name
Owned For
Owner Type
Purchase Details
Closed on
Mar 7, 2019
Sold by
Bass Joel N and Chen Wei Bing
Bought by
Bass Joel Nelson and Chen Wei Bing
Current Estimated Value
Purchase Details
Closed on
Dec 7, 2011
Sold by
Ma Zhong Ming
Bought by
Bass Joel N and Chen Wei Bing
Home Financials for this Owner
Home Financials are based on the most recent Mortgage that was taken out on this home.
Original Mortgage
$434,300
Outstanding Balance
$296,090
Interest Rate
3.94%
Mortgage Type
New Conventional
Estimated Equity
$948,311
Purchase Details
Closed on
Jun 23, 2011
Sold by
Huang Yan Ting
Bought by
Ma Zhong Ming
Purchase Details
Closed on
Mar 7, 2011
Sold by
Johnson Stephani
Bought by
The Bank Of New York Mellon and The Bank Of New York
Purchase Details
Closed on
Aug 18, 2003
Sold by
Roper Frank E
Bought by
Johnson Stephani
Home Financials for this Owner
Home Financials are based on the most recent Mortgage that was taken out on this home.
Original Mortgage
$81,000
Interest Rate
5.46%
Mortgage Type
Stand Alone Second
Purchase Details
Closed on
Nov 19, 2002
Sold by
Roper Frank E
Bought by
Johnson Stephani
Home Financials for this Owner
Home Financials are based on the most recent Mortgage that was taken out on this home.
Original Mortgage
$344,000
Interest Rate
5.75%
Purchase Details
Closed on
Jul 26, 2002
Sold by
Roper Frank E
Bought by
Johnson Stephani
Home Financials for this Owner
Home Financials are based on the most recent Mortgage that was taken out on this home.
Original Mortgage
$234,800
Interest Rate
6.6%
Purchase Details
Closed on
Feb 4, 2002
Sold by
Roper Frank E
Bought by
Johnson Stephani
Home Financials for this Owner
Home Financials are based on the most recent Mortgage that was taken out on this home.
Original Mortgage
$235,300
Interest Rate
7.04%
Mortgage Type
Balloon
Purchase Details
Closed on
Sep 25, 2000
Sold by
Johnson Stephani J and Johnson Frank
Bought by
Johnson Stephani
Home Financials for this Owner
Home Financials are based on the most recent Mortgage that was taken out on this home.
Original Mortgage
$55,000
Interest Rate
7.98%
Mortgage Type
Stand Alone Second
Purchase Details
Closed on
May 19, 1999
Sold by
Johnson Dwayne Edward
Bought by
Johnson Stephani J
Home Financials for this Owner
Home Financials are based on the most recent Mortgage that was taken out on this home.
Original Mortgage
$172,000
Interest Rate
6.86%
Mortgage Type
Purchase Money Mortgage
Create a Home Valuation Report for This Property
The Home Valuation Report is an in-depth analysis detailing your home's value as well as a comparison with similar homes in the area
Home Values in the Area
Average Home Value in this Area
Purchase History
| Date | Buyer | Sale Price | Title Company |
|---|---|---|---|
| Bass Joel Nelson | -- | None Available | |
| Bass Joel N | $543,000 | Chicago Title Company | |
| Ma Zhong Ming | -- | Landsafe Title | |
| Ma Zhong Ming | $390,000 | Landsafe Title | |
| The Bank Of New York Mellon | $432,000 | Landsafe Default Inc | |
| Johnson Stephani | -- | Placer Title Company | |
| Johnson Stephani | -- | Placer Title Company | |
| Johnson Stephani | -- | Placer Title Company | |
| Johnson Stephani | -- | Placer Title Company | |
| Johnson Stephani | -- | Chicago Title Co | |
| Johnson Stephani J | -- | Placer Title Company |
Source: Public Records
Mortgage History
| Date | Status | Borrower | Loan Amount |
|---|---|---|---|
| Open | Bass Joel N | $434,300 | |
| Previous Owner | Johnson Stephani | $81,000 | |
| Previous Owner | Johnson Stephani | $344,000 | |
| Previous Owner | Johnson Stephani | $234,800 | |
| Previous Owner | Johnson Stephani | $235,300 | |
| Previous Owner | Johnson Stephani | $55,000 | |
| Previous Owner | Johnson Stephani J | $172,000 |
Source: Public Records
Tax History
| Year | Tax Paid | Tax Assessment Tax Assessment Total Assessment is a certain percentage of the fair market value that is determined by local assessors to be the total taxable value of land and additions on the property. | Land | Improvement |
|---|---|---|---|---|
| 2025 | $9,988 | $675,001 | $204,600 | $477,401 |
| 2024 | $9,988 | $661,633 | $200,590 | $468,043 |
| 2023 | $9,784 | $655,525 | $196,657 | $458,868 |
| 2022 | $9,618 | $635,672 | $192,801 | $449,871 |
| 2021 | $9,644 | $623,074 | $189,022 | $441,052 |
| 2020 | $9,164 | $623,618 | $187,085 | $436,533 |
| 2019 | $8,841 | $611,395 | $183,418 | $427,977 |
| 2018 | $8,698 | $599,411 | $179,823 | $419,588 |
| 2017 | $8,381 | $587,661 | $176,298 | $411,363 |
| 2016 | $8,134 | $576,138 | $172,841 | $403,297 |
| 2015 | $8,030 | $567,488 | $170,246 | $397,242 |
| 2014 | $7,983 | $556,373 | $166,912 | $389,461 |
Source: Public Records
Map
Nearby Homes
- 1322 Virginia St
- 1919 Curtis St
- 1728 Curtis St
- 1631 Belvedere Ave
- 2118 California St
- 1128 Delaware St
- 1578 Allston Way
- 1368 Rose St
- 2144 Curtis St
- 1716 Hearst Ave
- 1013 Addison St
- 2218 -2222 Grant St
- 2324 Browning St
- 2013 9th St
- 2112 Mckinley Ave Unit D
- 940 Delaware St
- 1718 Bancroft Way
- 2010 9th St
- 1729 8th St
- 995 Virginia St
- 1387 Hearst Ave
- 1375 Hearst Ave
- 1393 Hearst Ave
- 1371 Hearst Ave
- 1820 Acton St
- 1361 Hearst Ave
- 1399 Hearst Ave
- 1865 Franklin St
- 1855 Franklin St
- 1359 Hearst Ave
- 1816 Acton St
- 1376 Hearst Ave
- 1807 Franklin St
- 1380 Hearst Ave
- 1370 Hearst Ave
- 1382 Hearst Ave
- 1366 Hearst Ave
- 1386 Hearst Ave
- 1401 Hearst Ave
- 1812 Acton St
Your Personal Tour Guide
Ask me questions while you tour the home.